


BLS Jobs Report Preview (January)
Sliding or Stable?

I’m publishing 2 pieces this week: a BLS jobs report preview (this one), and a BLS jobs report recap (Friday).
TL;DR: The labor market’s expansion continued in January. I’ll be looking for clarity on whether the job market is still cooling.
This preview is structured as:
The big picture: sliding or stable?
Annoying: Annual revisions & population controls
Wage growth
More below charts.


1. The Big Picture: Sliding or Stable?
My 2024 labor market outlook and preview of the December 2023 jobs report were tinged with optimism for two reasons - one about the present (signs of the labor market stabilizing after a lengthy period of cooling), and the other about the future (a rapid cooling of inflation allowing the Federal Reserve to relax the monetary policy brakes).
But the forecasting gods love surprises, and that optimism was shaken a little bit by the disappointing December jobs report and November JOLTS report. (And as of today, December’s JOLTS report was also not-great.) My “optimism about the future” is still alive and kicking - inflation is shaping up very nicely, and at some point the Fed’s pivot will put a floor under the labor market. But “optimism about the present” is less warranted, because it’s less likely that the labor market already stabilized.
Let’s start with what most data agree about: up until late spring or early summer, the pace of improvement in the labor market was moderating (i.e. negative 2nd derivative). Measures of labor market tightness were cooling. The disagreement is about what’s happened since. Some metrics think this cooling process has stopped or at least paused. Others suggest it’s continued or resumed.
A. Sliding Labor Market Indicators
I’ll start with one of my favorite indicators in the report - the share of prime working age Americans who have a full-time job. After reaching 80.9% in late spring and early summer (the highest since 2001), it’s fallen by 0.5 percentage points since (including a 0.3pp decline in December). As far as the “cooling is ongoing or even intensifying”, this indicator is particularly concerning.

The November and December JOLTS reports mostly fall into the same bucket. Hires and quits were pretty stable during the summer and early fall, but have fallen again since then.


B. Stable Labor Market Indicators
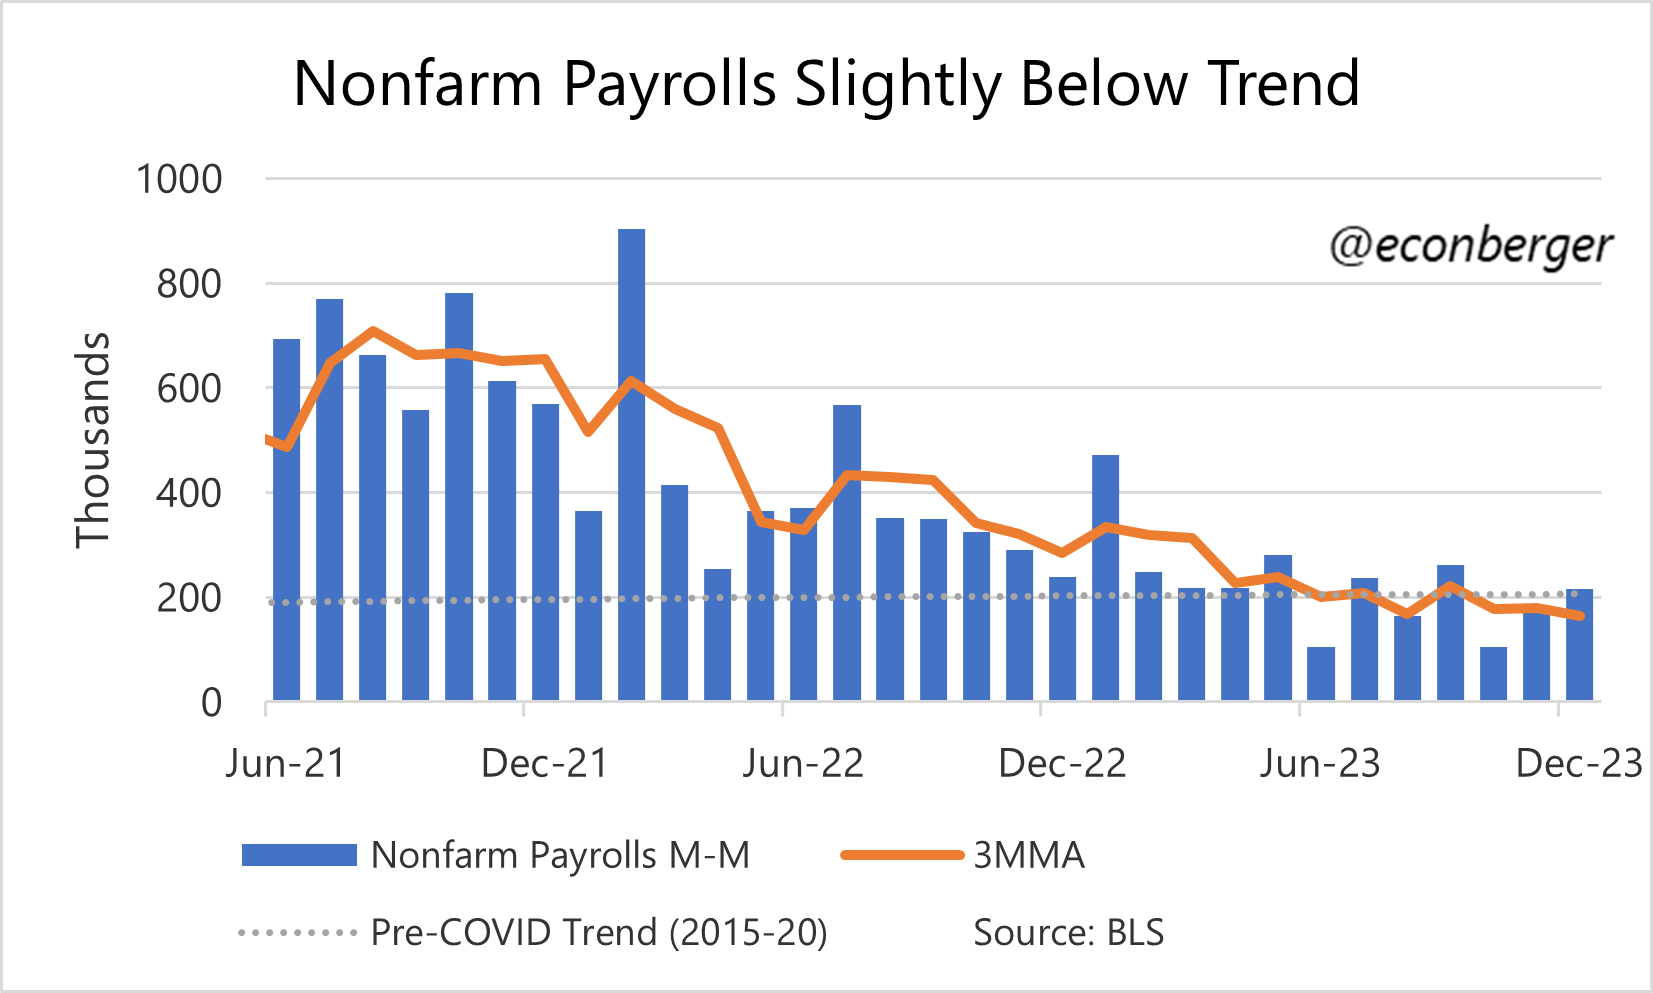
But not all the data agrees with this “cooling ongoing” trend. For instance, nonfarm payroll employment shows a meaningful flattening since the summer (i.e. the 2nd derivative becoming less negative, or even zero).1
Layoffs in the JOLTS report show no signs of deterioration.

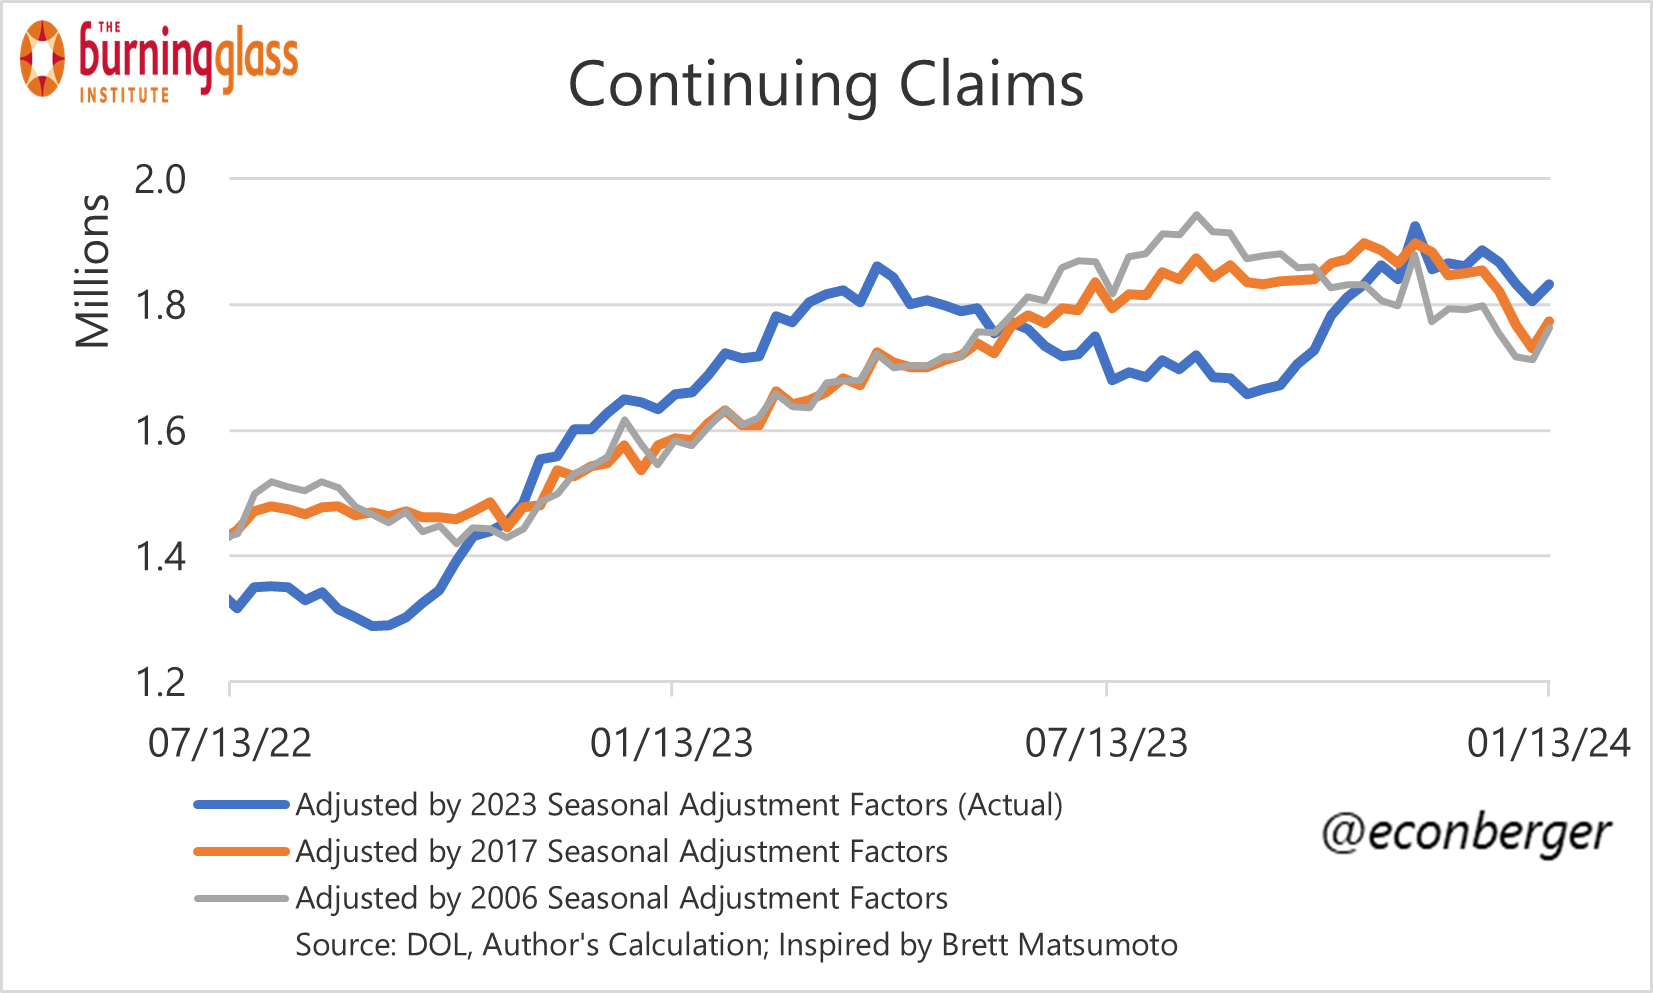
Likewise the unemployment insurance claims data have been quite benign; continuing claims stopped rising sometime between August and December, depending on which seasonal adjustment factors you use.
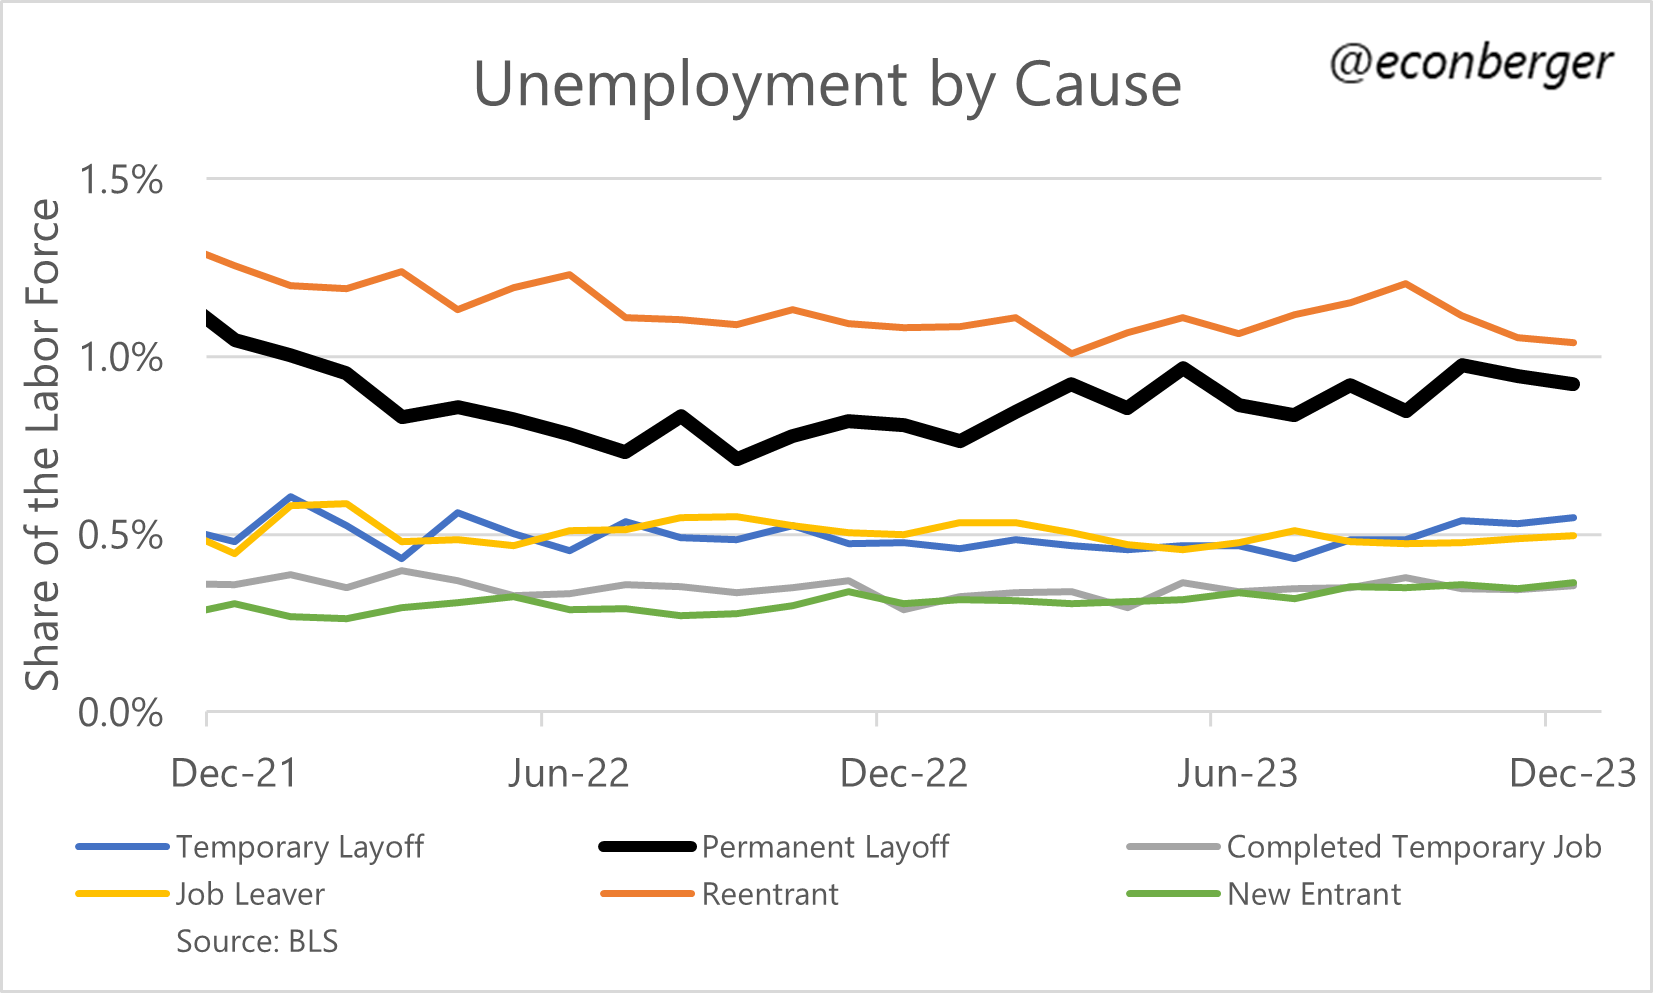
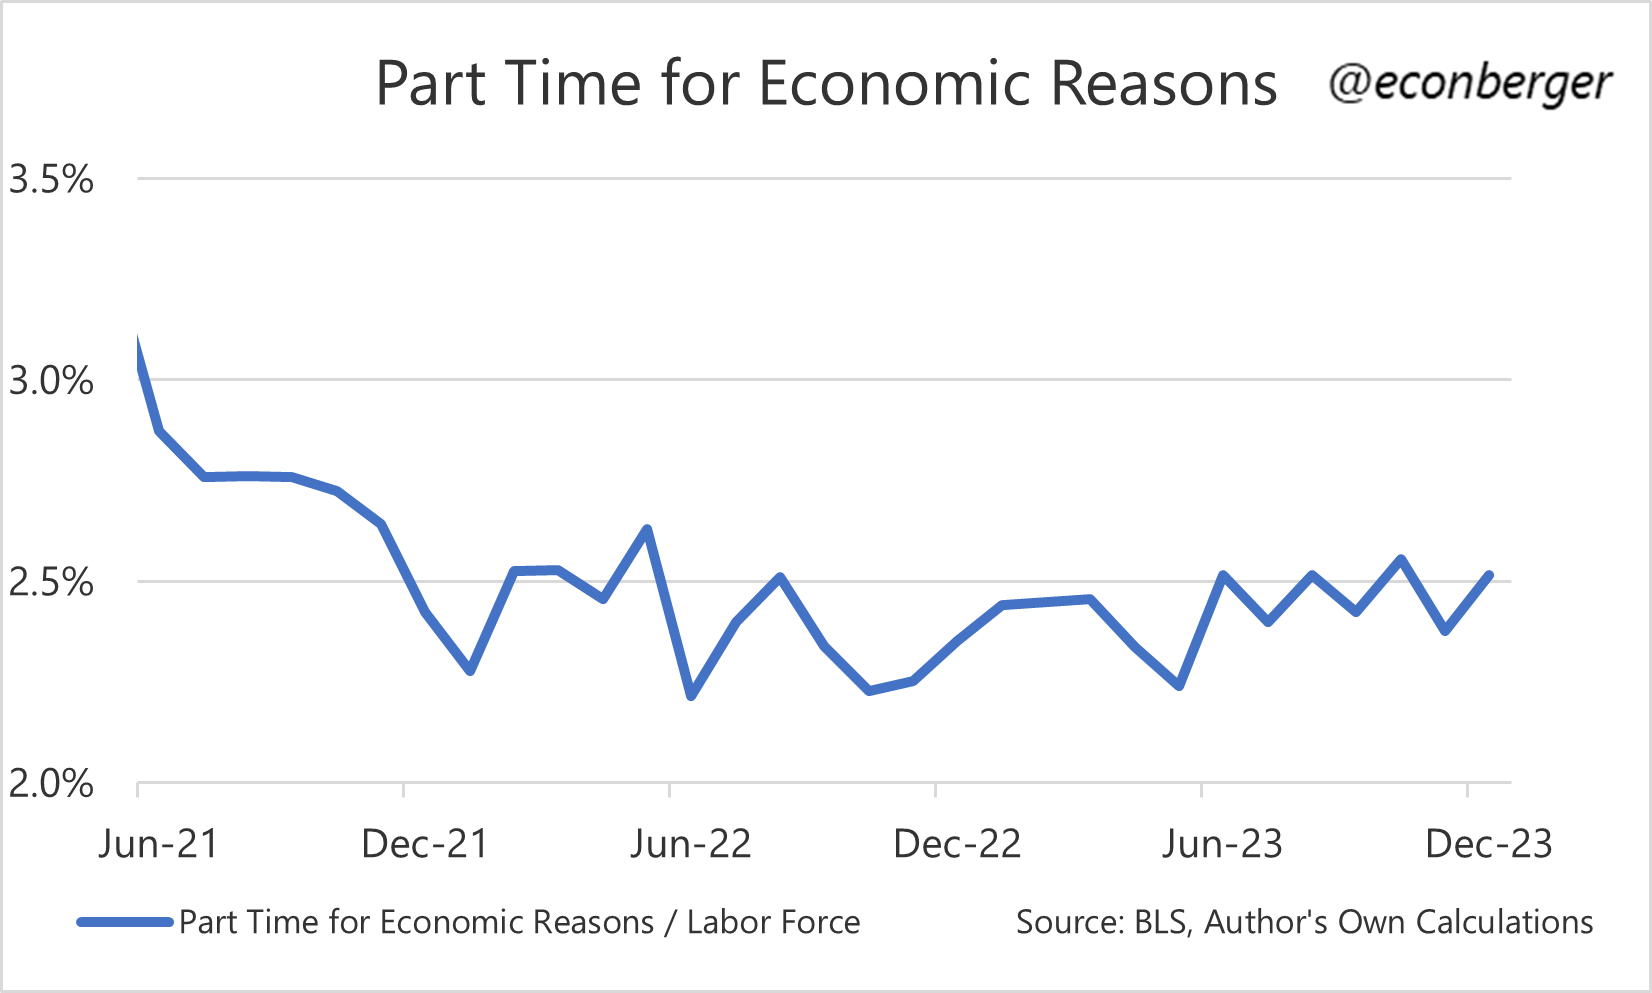
The unemployment rate has not gone up since August. Several other indicators from the Household Survey (unemployment due to permanent layoff, part time for economic reasons) tell a similar story - things have cooled relative to 6-12 months ago, but not recently.

Hopefully Friday’s report will resolve this disagreement between labor market indicators. Even more hopefully, the resolution will fall on the side of good news.
2. Annoying: Annual Revisions and Population Controls
Both halves of the employment report get technical “retrofits” this month that often trip up consumers of the data. I’d be extra careful with any charts or commentary you write on Friday morning.
On the Current Establishment Statistics (CES, or “establishment survey”) side, we get the annual revision. The BLS will go back and change not-sesonally-adjusted data going back to April 2022 (most significantly nonfarm payroll employment, though hours and wages will also be affected). There will also be a revision of the seasonal adjustment factors going further back.
The changes in the not-seasonally-adjusted data are of course more interesting and fundamental. We know part of what they’ll tell us - the preliminary benchmark announcement indicated that employment in March 2023 was 306K lower than previously estimated (so about ~25K fewer job gains per month in the prior year). But beyond that, the net birth-death model will get updated for the period subsequent to March 2023, and could change our perspective on the economy’s recent trajectory.
Up until December’s jobs report I was leaning toward the side of “I don’t expect big revisions” because the concept-adjusted household survey employment count had a similar tally to nonfarm employment. But the former took a big dive in December (it’s a very noisy series) and I’m a little more nervous about downward post-March-2023 revisions as a result.

The other half of the jobs report is the Current Population Survey (CPS, or “household survey”). There won’t be any revisions to historical data here, but the January data will involve “population controls” - a rebasing of levels within the report to Census population estimates. These controls typically don’t cause much of an impact to the ratios we care about (unemployment rate, employment/population ratio, labor force participation rate), but they do mess up things like M-M level/absolute changes. (We’ll see plenty of folks erroneously looking at the M-M change in employment or the labor force without subtracting the population controls.)
A year ago the population controls were important because the BLS had been undercounting population growth (and therefore, the size of employment and the labor force too). We’ll see what happens this time!
3. Wage Growth
There was an spike in wage growth during December. On a 3-month annualized basis, both measures of average hourly earnings (for all private sector workers, and for non-managerial private sector workers) accelerated above 4% - a level that Fed Chair Powell has described as a little too high. My guess is that this will fade and/or get wiped out by revisions in January’s data.

Last month I discussed an n=1 reason to expect revision wipeout: response rates to December’s establishment survey were exceptionally low in this initial print, and last time they were this low we also got an anomalous non-revision-durable wage growth spike.

Beyond that, last month’s spike was associated with a decline in the average workweek. To the degree this decline this decline impacted salaried (non-hourly) workers, they would have experienced an unusually large increase in average hourly earnings. Even if the decline in the workweek doesn’t reverse, at the very least I wouldn’t expect it to repeat - leading to a more normal increase in wage growth.
Friday’s revisions could change our perspective on this data.