


BLS Jobs Report Recap (January)
More Evidence That the Job Market Is Stabilizing

TL;DR: Evidence in this month’s jobs report solidifies my suspicion that labor market cooling is on pause, and the job market is stabilizing.
Key Data Points:
Unemployment rate: fell from 4.09% to 4.01% (good)
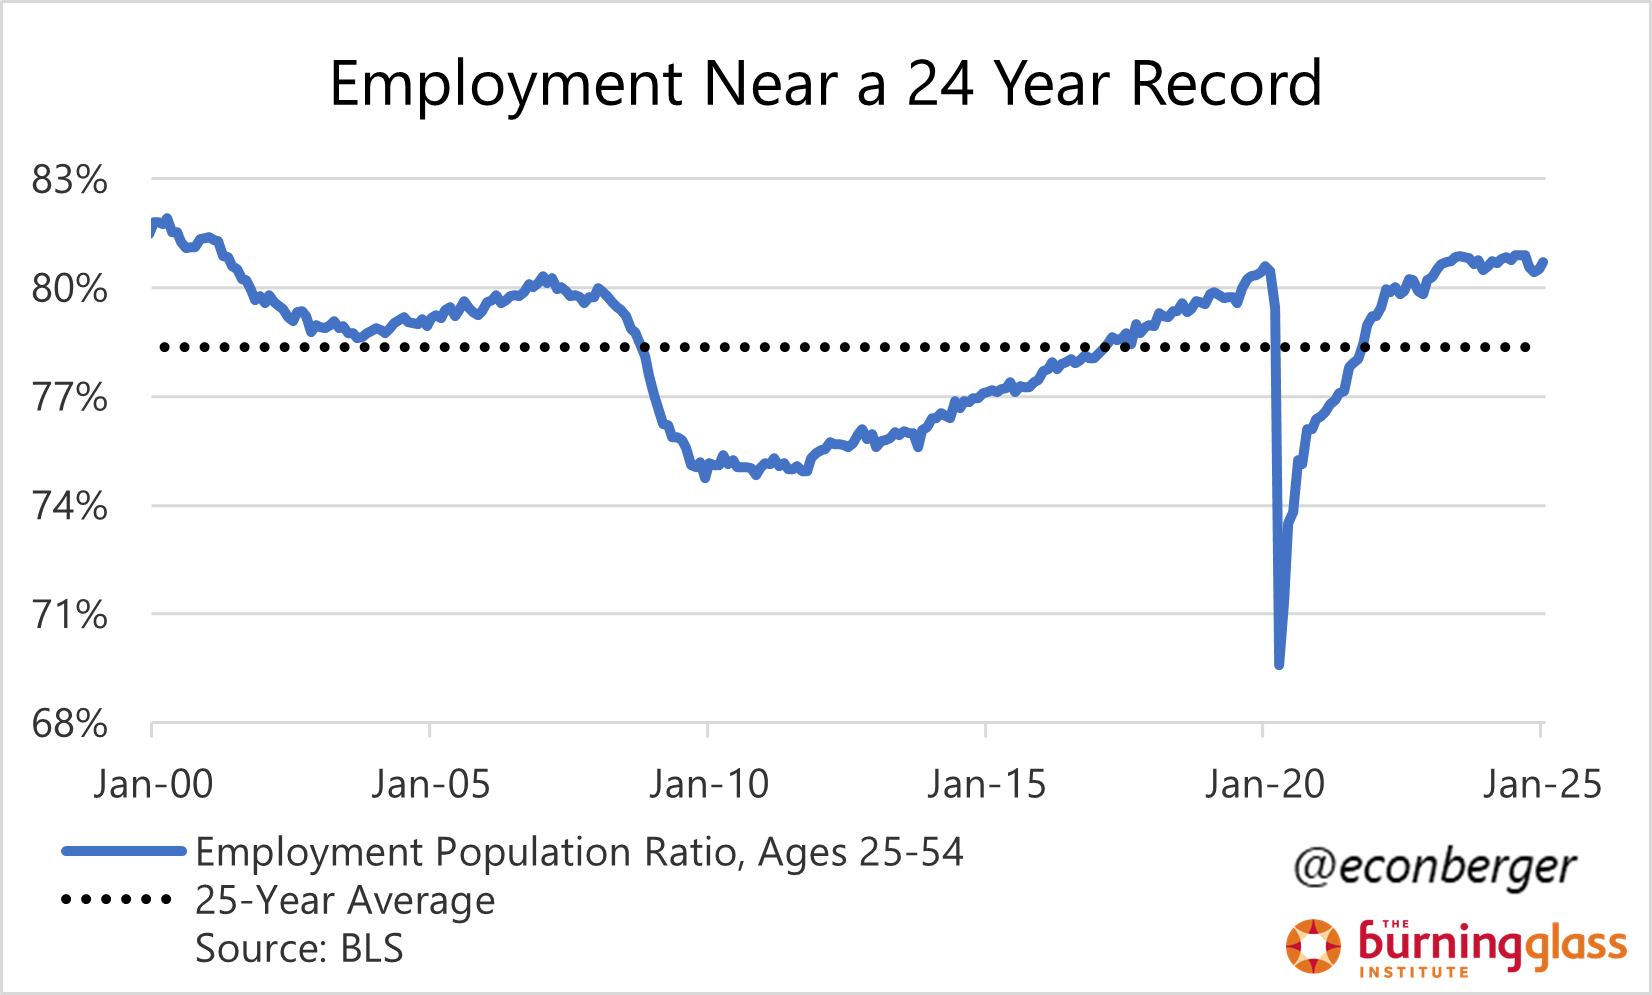
Prime working age employment population ratio: rose to 80.7% (good)
Nonfarm payroll employment: rose by 143K (ok)
The rest of this recap is split into 2 sections:
The Big Picture
Trends in Labor Market Slack
Weather
Revisions
More below chart.

1. The Big Picture
You’re probably sick of me saying this, but I think that, conditional on the government policies I anticipate will be adopted, labor market cooling will end in 2025.1 Indeed, you can make a case that it has already ended (#1, #2), and today’s report provided additional evidence in that direction.
My perspective is that we shouldn’t overweight any single job report; it’s useful to have a probabilistic view of the world, with each new chunk of data altering those probabilities. So today’s report is just a little more confirmation that labor market cooling has ended, and lowers the probability that labor market cooling is ongoing. A weak report next month could swing the pendulum back.
To wrap up this section with some wild speculation: if policy evolves in the direction I expect - contractionary for labor supply, supportive for labor demand - then at some point later this year we might start asking if the labor market is heating up again.
2. Trends in Labor Market Slack
The unemployment rate fell to 4.01%, its lowest level since May 2024, and is now about 0.3 percentage points below where the Fed anticipates it finishing the year. (So we’re going to need quite a bit of improvement in inflation in order to get more rate cuts this year.)

We’re also seeing a rebound in the prime working age employment population ratio, which rose to 80.7% in January is once again just shy of its 24 year high:
The share of the labor force that is working part time for economic reasons increased marginally in January, but is basically where it was a year ago:

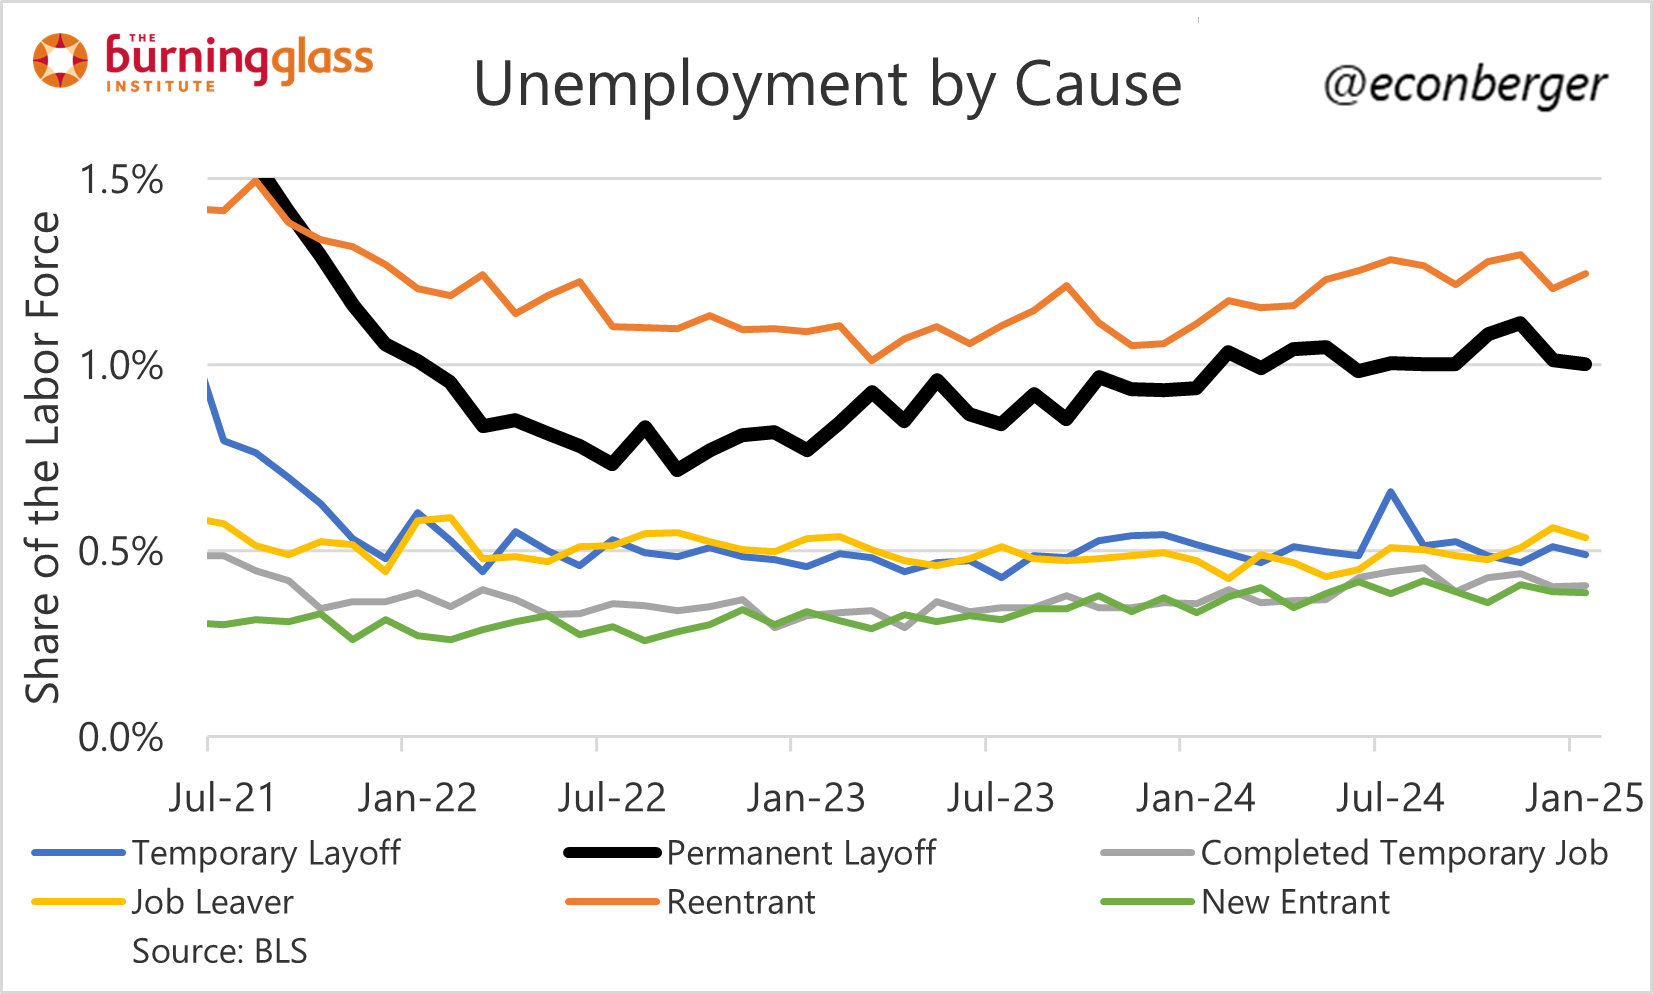
And the most recessionesque component of unemployment (“due to permanent layoff”) was flat this month, and is only slightly above year-ago levels:
As stated earlier, all this can change, and not all of these data are providing decisive evidence that labor market cooling has stopped. But it’s providing some evidence, and more than we had before.
3. Weather
I’ve talked a lot about data from the household survey, and will spend the final section discussing nonfarm payroll employment, but it’s worth considering the impact of the weather and fires on establishment survey data. Mid-January was when Los Angeles was being devastated by fires, and there was a big snowstorm in the Northeast.
We know that absences due to weather were higher than seasonally normal in January 2025:

It’s a little blurrier as far as folks who normally work full-time hours but only work part-time hours, but also looks a little elevated:

The way the establishment survey works is that people who have a job but are temporarily unpaid (for example, because they had to miss work due to weather or a natural disaster but are paid hourly) won’t count as employed. If they work fewer hours than normal, their workweek will be shorter too. So it’s possible that nonfarm payroll employment will rebound next month, and also that the average workweek will rebound from its January dip. (Though the BLS said they saw no effect in the data from these events.)

I also wonder whether this dip in the workweek is associated with the January spike in pay growth we saw. (Some folks working fewer hours for the same money? Workers who earn lower pay more likely to be absent?) I think it’s way too early to say “pay growth is reaccelerating”, though if the job market heats up again it will definitely be in the cards.

4. Revisions
At this point others have discussed the closure of the big gap between the household survey and establishment survey, and you may have seen a variant of this chart:

Basically, prior to today’s release, the gap between the establishment survey count (nonfarm payroll employment) the household survey count (adjusted for the nonfarm payroll employment concept) was a whopping 4.30 million. The employment adjustment to population controls (plus Dec-Jan change) sliced off about 2.38 million off the gap; the downward revision to nonfarm payroll employment (plus Dec-Jan change) knocked off 0.47 million; and now we’re at a gap of 1.46 million, which is much more normal.
The other thing that I thought was interesting was the post-March-2024 revision of nonfarm payroll employment.2 In my preview of today’s report I speculated that this could be negative - i.e. nonfarm payroll employment weakness persisted past the benchmark date. But I was mostly wrong. The revision to post-March-2024 data was only marginally negative. Negative numbers were concentrated in the period through the summer, and were partly offset by positive revisions in November and December.

The post-benchmark revisions misfired last year - which is why we ended up with a big negative benchmark revision this year. Could we be in for a repeat? I think it’s possible but it’s way, way, way too early to tell. It does seem like there’s a large residual overcount in nonfarm payroll employment as of June 2024. The Q2 QCEW is likely to get revised up, so some of this gap will close, and really we’re just talking about 1 quarter of data in a notoriously noisy time series. So I’m going to lean in the direction of “negative revisions to post-March-2024 data in the next benchmark are more likely than not, but may be small (or not materialize at all”. We’ll have a better idea on February 19th, when the QCEW Q3 data comes out (then we’ll have 50% of the benchmark data in hand instead of just 25%).

But also, a different combination of some of the policies - for example, aggressive cuts to government spending without a tax cut offset - could push us in the opposite direction.
The benchmark revision of employment in March 2024 was “as expected”.