


BLS Jobs Report Preview (January)
Lots of revisions

TL;DR: The first jobs report of 2025 will incorporate massive revisions to prior data, but also give us a peek into whether the labor market has stabilized.
This post will cover the following topics:
The Big Picture
Revisions
Revisions Are Big This Time
Caveat Emptor
In Praise of the Household Survey Ratios
The Household Survey Population Controls
The Establishment Survey Annual Revision
Coda: Save the Data!
More below chart.

1. The Big Picture
A lot has happened since the last time I wrote one of these! We almost imposed massive tariffs on some of our biggest trading partners but paused those plans at the last moment. There is also an effort underway to possibly cut government spending, or maybe not. I wrote the following about last week’s Fed meeting:
It’s really hard to forecast right now. There are a lot of ideas floating around, some of which will boost inflation and/or labor markets; others which might cool them.
That said, my working assumption for future policy is a combo of hotter demand via unfunded (or at least not fully funded) tax cuts and weaker supply (via tougher immigration policy). I also anticipate that the Fed will aim to keep the labor market where it is (conditional on inflation evolving roughly as expected) - if significant additional cooling develops, it will ease further, and if the labor market shows signs of heating back up, the Fed will keep its foot on the brakes.
What that adds up to: stabilization in the labor market, and an end to the cooling process that began in 2022. There are some tentative signs that this is already underway (my confidence in this happening already is low; I’d characterize it as a 60/40 belief). If you look at the unemployment rate, it hasn’t gone up since the summer. (The Fed statement called this out last week, and Powell mentioned it several times.)
Stabilization is also apparent in other data indicators. For example, hiring and quits stopped falling around the same time the unemployment rate stopped going up.
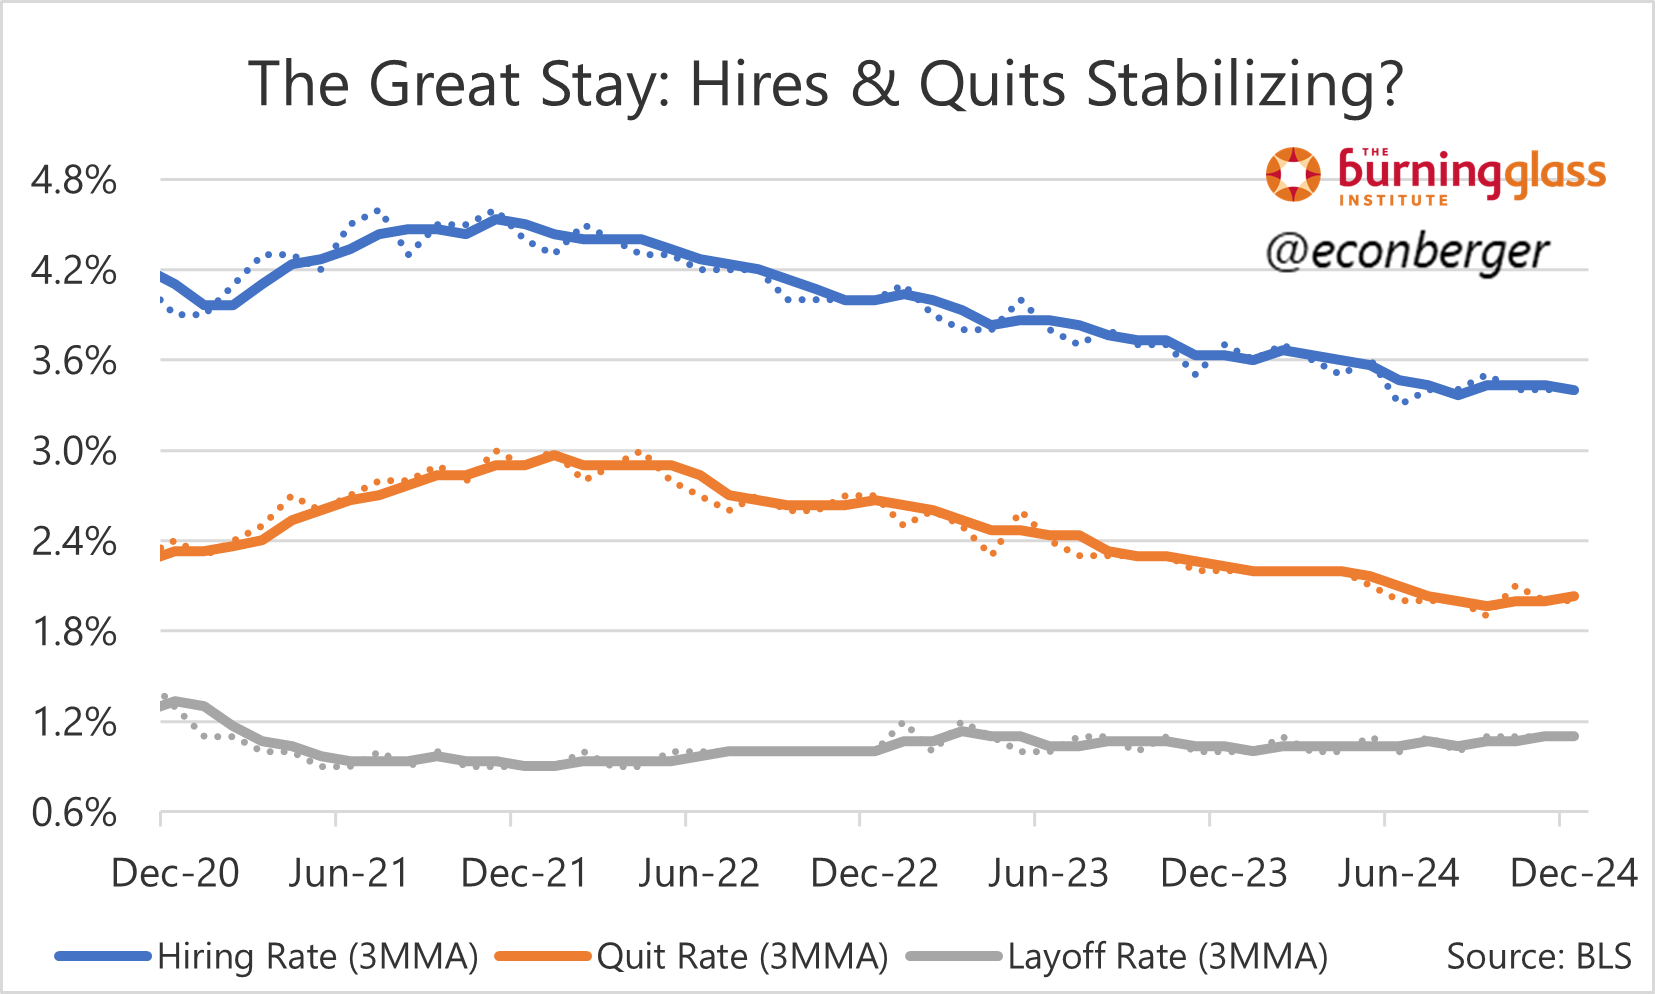
You can also divine signs of no-more-cooling in part-time-for-economic reasons which has reversed almost its entire increase since the summer of 2022.

An indicator that’s more ambiguous: the prime working age employment population ratio (our best all-in metric from this report), which dipped a little in the fall of 2024 and has rebounded only a little since. If we’re really stabilizing I’d expect more of that dip reversing in the coming months.

I’d also expect no further deterioration in the permanently-laid-off unemployment rate. We did see this descend a little in December but it’s pretty thin evidence.

Finally, it’s not in the monthly report, but layoff data seems to be moving slightly in the opposite direction; initial claims and layoffs in the JOLTS data are up a little year-over-year. I don’t want to make too much of this, at least not yet, but it’s good to have a holistic view of the data.

There are always headfakes; what looks like tentative stabilization might turn out to be a mirage.1 If you go through this substack’s archives, I’ve anticipated stabilization at various points in the past - and have been wrong so far! Feel free to keep me honest.
2. Revisions
A. Revisions Are Big This Time
We’re getting a boatload of revisions and quasi-revisions on Friday; some will be negative and some will be positive. This process is “routine” in the sense that it happens every year; what’s non-routine this time is the magnitude involved.
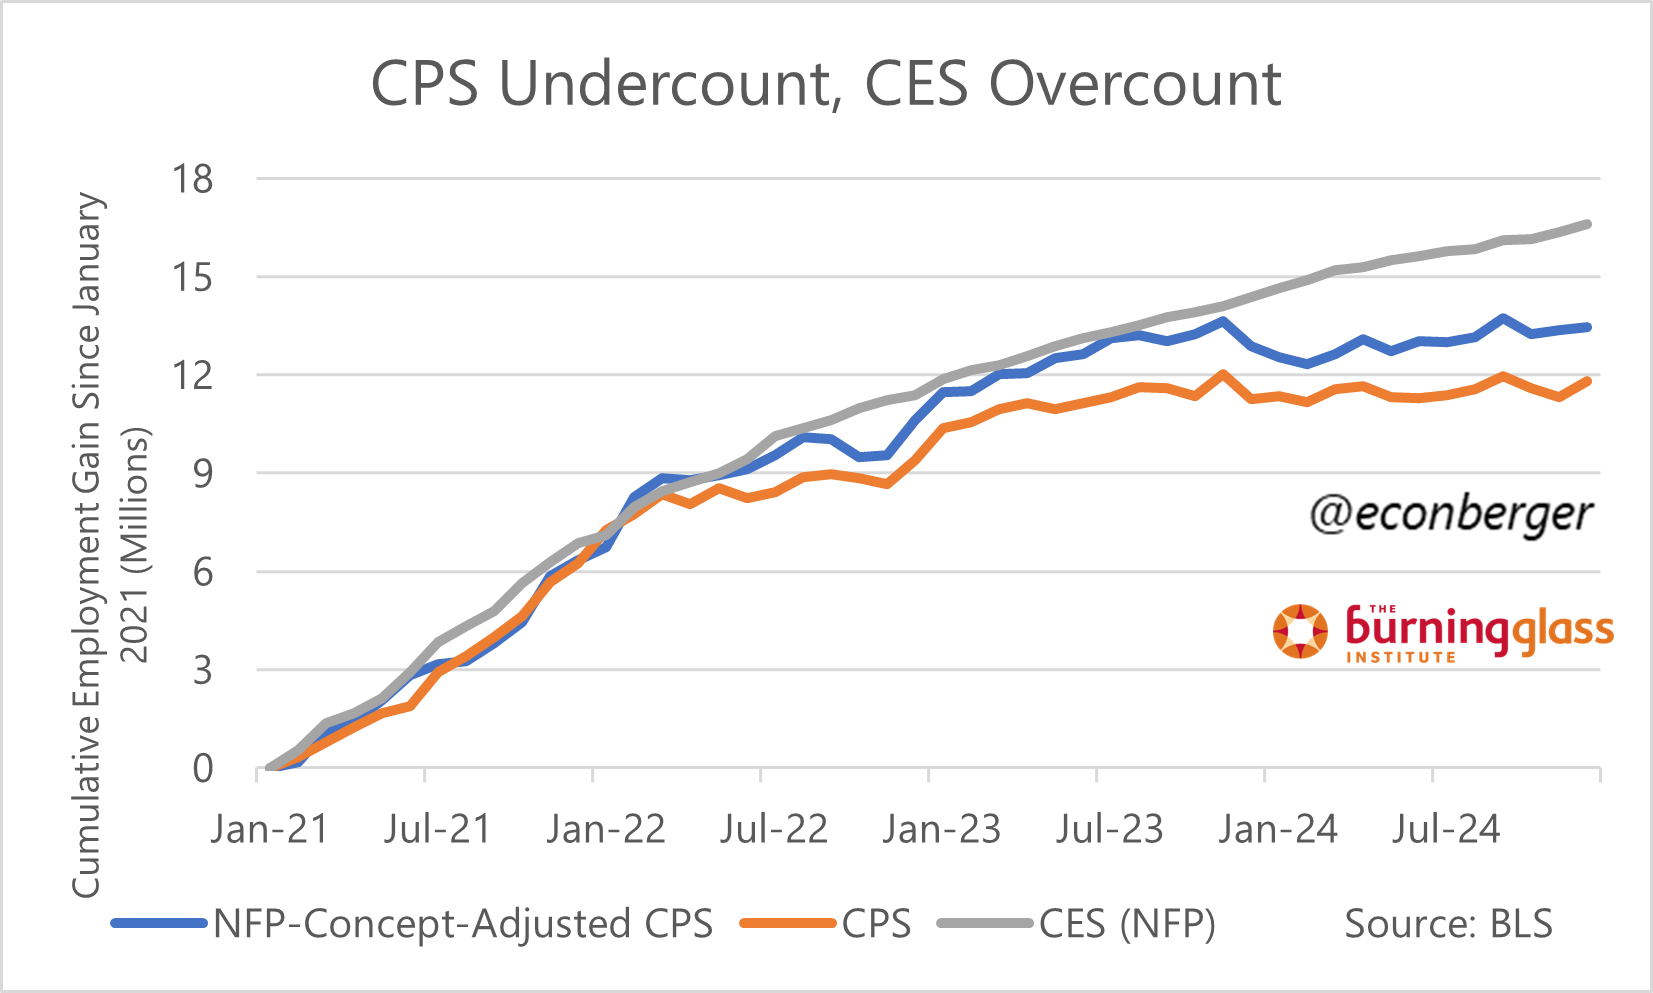
The monthly jobs report is based on two data sources, the Current Population Survey (CPS, also known as “the household survey”) and the Current Establishment Statistics (CES, also known as “the establishment survey”). The CPS is the source of data like the unemployment rate, part-time employment and the employment population ratio; the CES generates data like nonfarm payroll employment and average hourly earnings.
Both surveys generate a count of employment, and while the levels between the two are different (due to different measurement concepts - for example, the establishment survey count excludes self-employed and agricultural workers, and double-counts people with 2 jobs), they usually track each other over time.
Usually, but not always. The gap in employment growth between the CES and CPS over the past 4 years is a massive 4.8 million. If you modify the CPS count to match the CES more closely, that gap closes somewhat, but is still huge at 3.2 million. And 2.9 million date from the past 21 months (since March 2023, the most recent “benchmark date” for the CES). This gap is driven by a very large CES overcount and an even larger CPS undercount, which I’ll talk about in sections 2D and 2E below.

B. Caveat Emptor
Before getting into the revisions themselves, a warning: some analysis you’ll read will come in with an axe to grind. There will also be plenty of unintentional/accidental misinterpretations. Be careful out there!
C. In Praise of the Ratios
I stated earlier that revisions are going to be large. That said, they will affect some data a lot and leave other key data mostly untouched. One part of the report that will be altered only marginally: the most important ratios from the household survey. Most, but not all, of the charts I shared above, fall into that bucket. What this means is, if you’re relying mostly on this data to understand the labor market (which you should be), your understanding won’t be changed materially by revisions.
The impact on this data will be small because the Household Survey Population Controls (see Section 2D below) affect all the data in the report - both numerators and denominators. Unemployment, employment, labor force, and the population have all been undercounted!
The impact won’t be zero because the population undercount isn’t uniform across groups, some of which may be over- or under-represented in various aggregates. But it will be very small for most of the aggregate ratios we follow most closely.
At least for the headline-generating series like the unemployment rate, you’re going to be able to calculate the effect of the population controls very easily because the BLS report will include a table like this one.

If you’re interested in calculating the more sophisticated metrics (like the prime-working age employment/population ratio or the share of the labor force that is part-time for economic reasons), you should go to this page on Friday and download the file titled “Supplemental XLSX table of latest population adjustment effects”, then go to the tab that’s titled “Detailed Table”.2
D. The Household Survey Population Controls
The main cause of the CPS undercount is an underlying Census Bureau population undercount. The CPS surveys about 50,000 US households each month, and gives each one of them a “weight” based on the population’s size. But those weights rely on the Census population estimates, and those Census estimates are currently way too low (primarily due to immigration).
What will happen on Friday is the BLS will apply a one time “jump” to the January data. Unlike the revisions to the CES (which I talk about in the next section), these jumps are not applied in a retrospective manner. The January employment, unemployment, labor force and population counts will be meaningfully bigger than the December ones solely because of this effect, regardless of what the job market did between those two months.
It’s usually not a good idea to compare M-M employment changes in CPS data because they are way too noisy, but doing so mindlessly will be a total disaster in Friday’s report because this one-time population adjustment will drive almost all of it.
This piece is already turning too long, but if you’re interested in more information about the household survey population controls, I strongly recommend reading Jed Kolko’s essay in Kevin Rinz’s Briefing Book.3 Jed’s one of the best economists in the business, and Briefing Book is just an outstanding newsletter.
E. The Establishment Survey Annual Revision
Though smaller than the upward revision in the household survey, the downward revision in the establishment survey has gotten more attention so far. There are 3 parts to the revision:
Revision to seasonally adjusted data going back 5 years
Benchmark revision to data from March 2023 to March 2024, based on the annual benchmark process
Revision to data after March 2024, based on new birth-death model projections
I’ll talk about each of these below, but an important point: none of these will touch the key household survey ratios. If you’ve been taking the nonfarm payrolls data too literally, then you were too optimistic about the labor market. But if you’ve been thinking “the unemployment rate has risen a little over the past 12-18 months, so the labor market has cooled somewhat over this period”, then your view about the labor market’s health is agnostic about these revisions - as it should be.
Of course, if you’re in the business where optics or doomerish content matter a lot - we’re going to see some double-digit nonfarm payroll increases crop up in the recent historical record, and possibly also a stray single-digit or negative number.
E1. Revision to seasonally adjusted data going back 5 years
1 is mostly a nothingburger - the wiggles in the pre-March-2023 data will change, but nothing substantive.
E2. Benchmark revision to data from March 2023 to March 2024, based on the annual benchmark process
2 has been discussed quite a bit. The level of nonfarm payrolls as of March 2024 will be revised down based on data from the Quarterly Census of Employment and Wages (QCEW). That downward reduction will be divided up among the 12 months leading up to that period - i.e. payroll growth will be slower in most if not all of the prior 12 months. Sometimes folks erroneously believe that the intra-year wiggles in the QCEW will be applied to the NFP data, but this is not correct - only the March QCEW data is used.
One important bit is that the preliminary benchmark estimate of -818K (about -67K per month) is probably an overestimate. Revisions of the March QCEW data since that estimate have been large and positive, so we’re probably looking at a revision closer to -670K (about -56K per month).
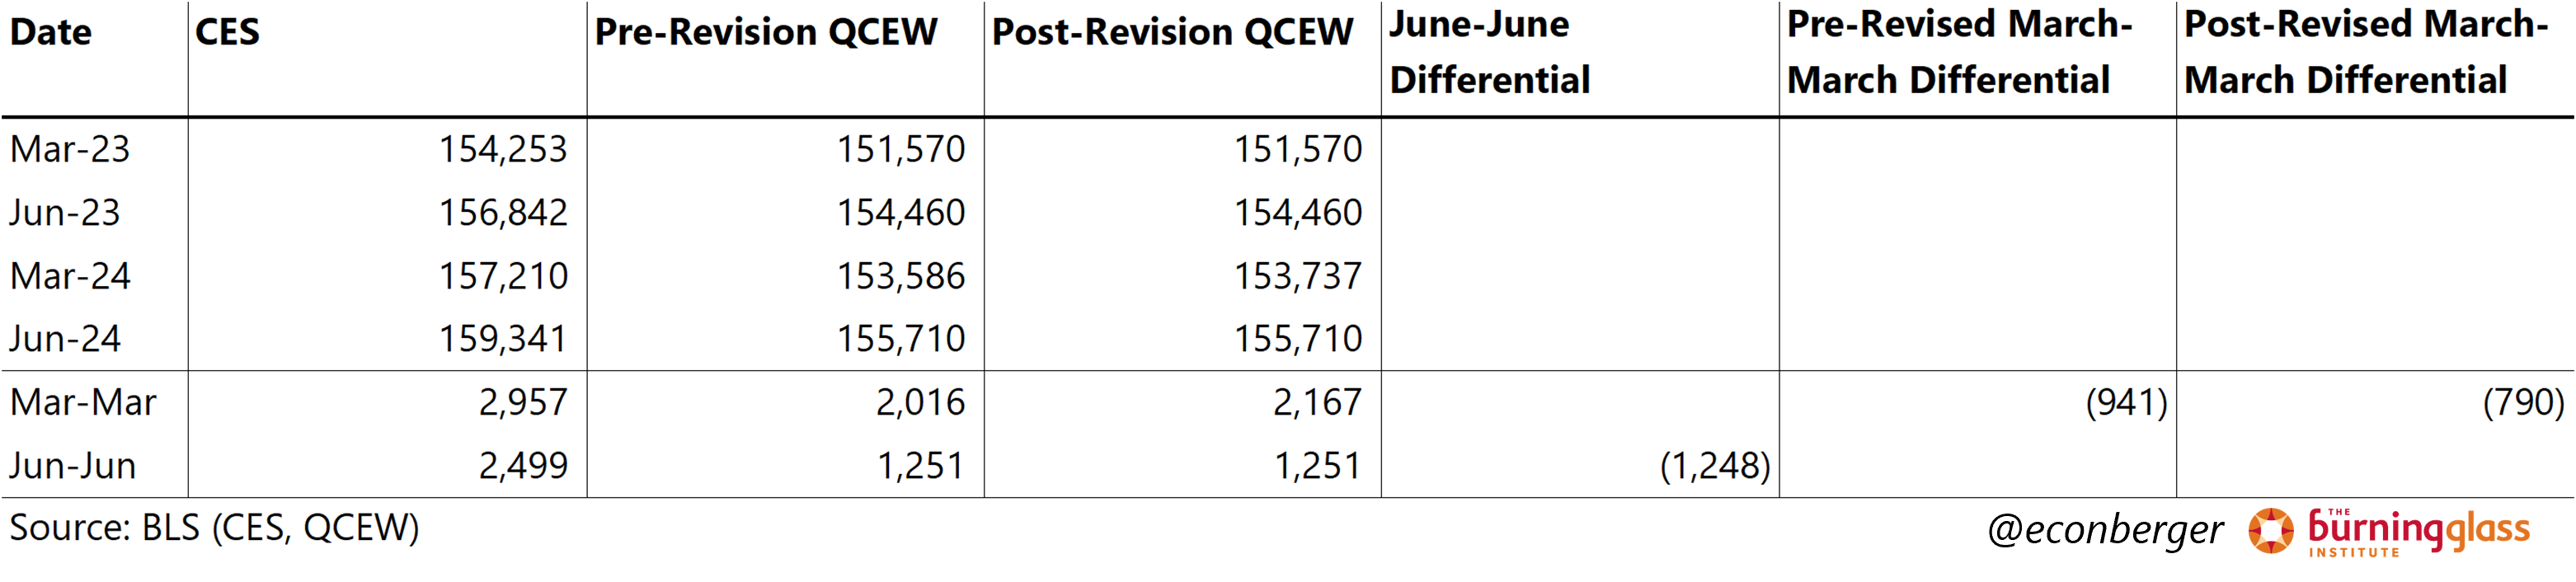
E3. Revision to data after March 2024, based on new birth-death model projections
If you look at the table above, you’ll notice that the June-June differential column has a very large negative number. Basically, the QCEW data that postdates the March 2024 benchmark date shows a growing gap between the CES and QCEW counts. What should we make of this, and what does it imply for the post-March-2024 revisions to nonfarm payroll employment?
Let’s start with: the post-March-2024 QCEW data (for which we have just 1 quarter so far) will not be applied to nonfarm payrolls until early 2026 (we’ll get a preliminary benchmark estimate this summer). The QCEW data is very noisy and susceptible to revision, and I definitely wouldn’t take it at face value (“OMG! the undercount is getting worse!!!!”).
However, I do think it’s fairly likely that a large nonfarm payroll overcount continued past March 2024, and that we’ll see downward revisions to that post-benchmark-date data on Friday. The BLS recalculates its net birth/death projections for data in that period, which ideally reduces the size of future benchmark revisions by bringing the data into line with reality earlier.
Of course, last year that process “misfired” - the revision actually increased the estimate of post-March-2023 employment; if it hadn’t done so, we’d be looking at a much smaller downward benchmark revision this Friday. But it does suggest a risk that we don’t get what we expect.
For what it’s worth, I’ve been mentally thinking of the payroll numbers post-March 2024 with this kind of adjustment (grey line; I’m using the preliminary benchmark estimate of -818K which is too negative, but you get the gist):

3. CODA: Save the Data
I am extremely grateful for the Bureau of Labor Statistics, Census Bureau, Bureau of Economic Analysis, Employment & Training Administration, and other government agencies who produce economic statistics. High quality data collected and published by the government are among our nation’s crown jewels. Let’s not damage them.
That’s why I’d characterize my believe in stabilization *so far* as weakly held. I’m more confident in stabilization going forward, conditional on adoption of demand boosting and supply contracting policies.
One thing you’ll notice is that for some of the smaller CPS subsamples - for example, Asian Americans or ages 16-24 - the change in key ratios is sometimes non-trivial.
One thing I learned from Jed’s piece is that the underlying population estimates from the Census will be revised back for a few years. What this means is that the population controls applied to the household survey as of January 2025 should be viewed as correcting undercounts over a few years of retrospective history, not just the past year.
Another thing worth reading is Jed’s discussion of the foreign-born/native-born counts. Essentially, the CPS population reweighting is based on several characteristics, but not immigration status. Which means the BLS will “erroneously” (as a result of their methodology) attribute the increase in population to native-born workers rather than foreign-born workers, despite the primary cause being immigration.
Great work thx