TL;DR: A decent jobs report, but the labor market is still cooling.
Key Data Points:
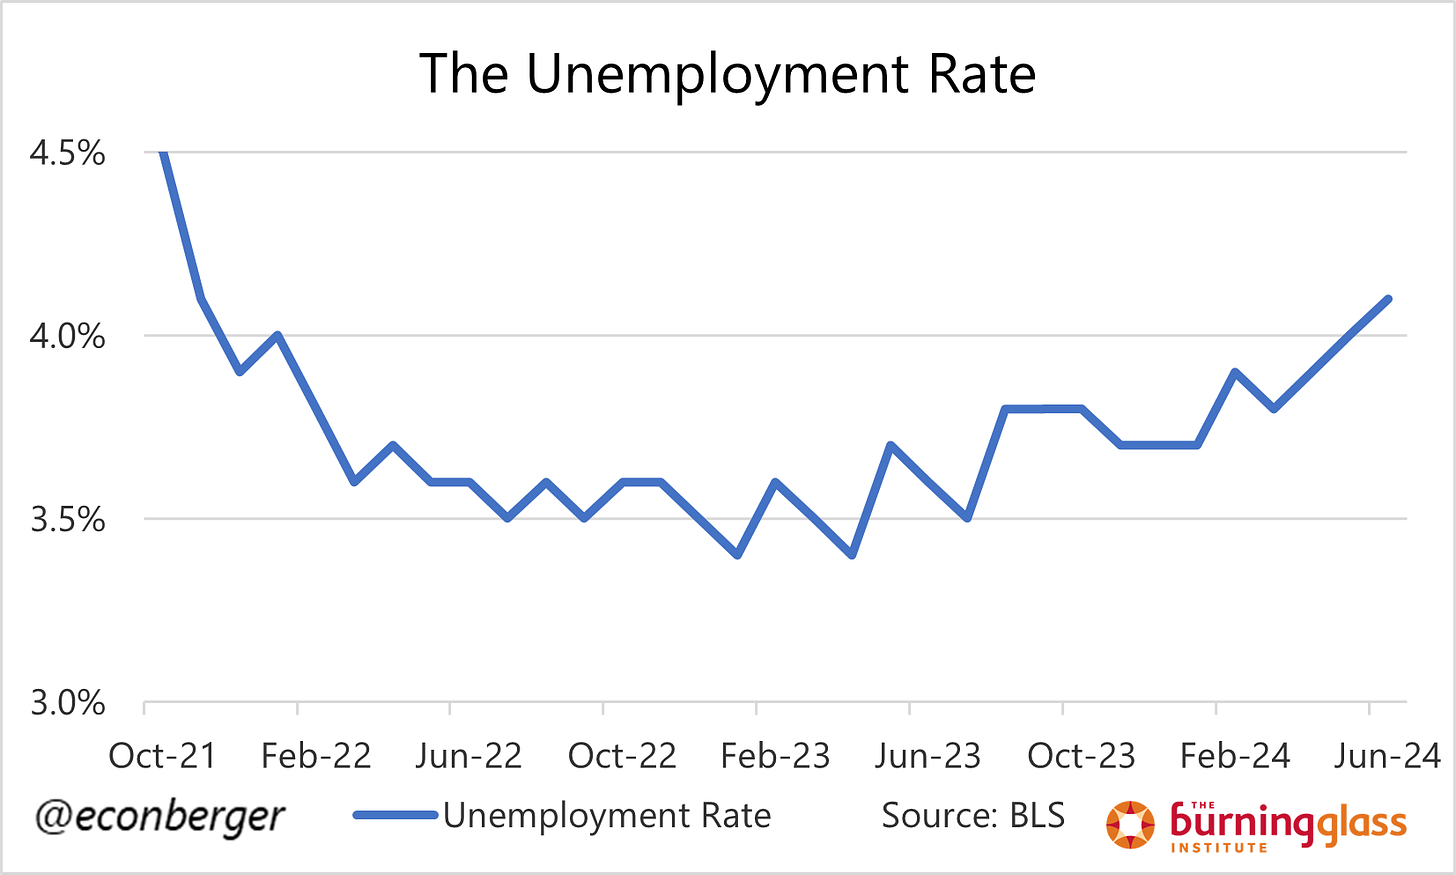
Unemployment rate: rose to 4.1% (not good)
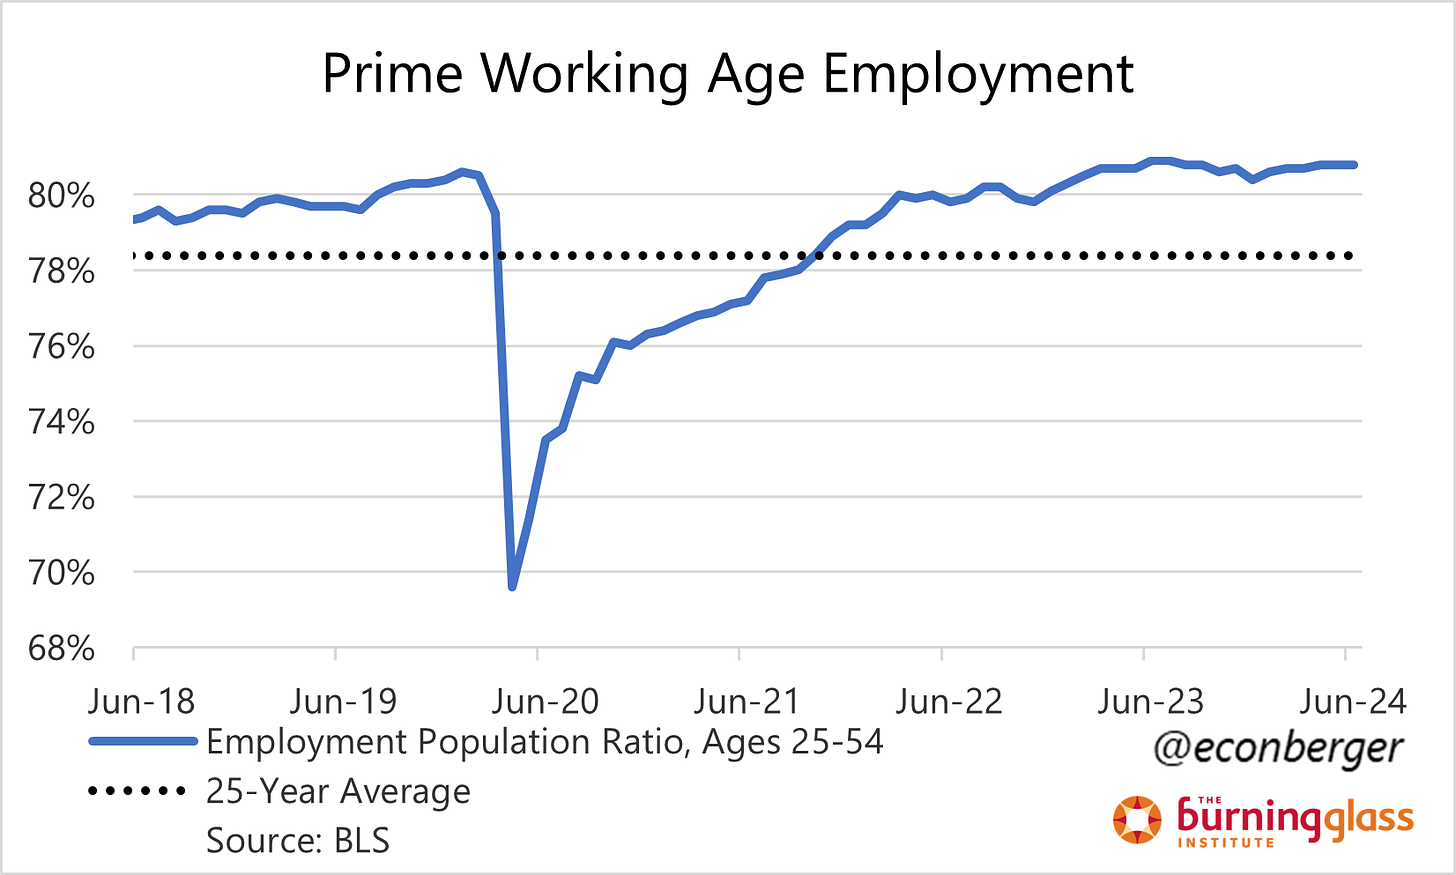
Prime working age employment population ratio: unchanged at 80.8% (not bad)
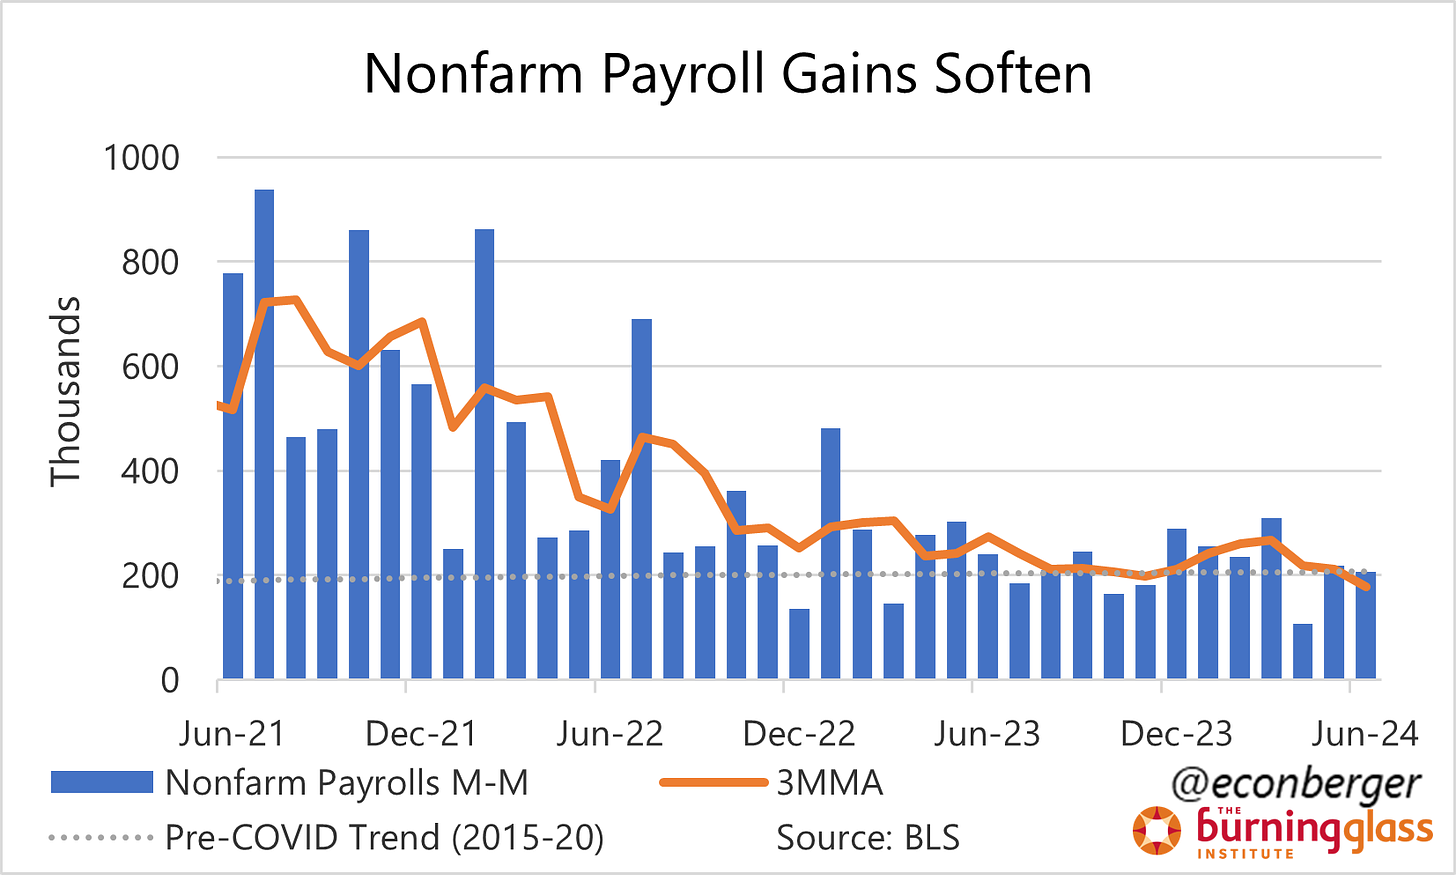
Nonfarm payroll employment: rose by 206K (solid)
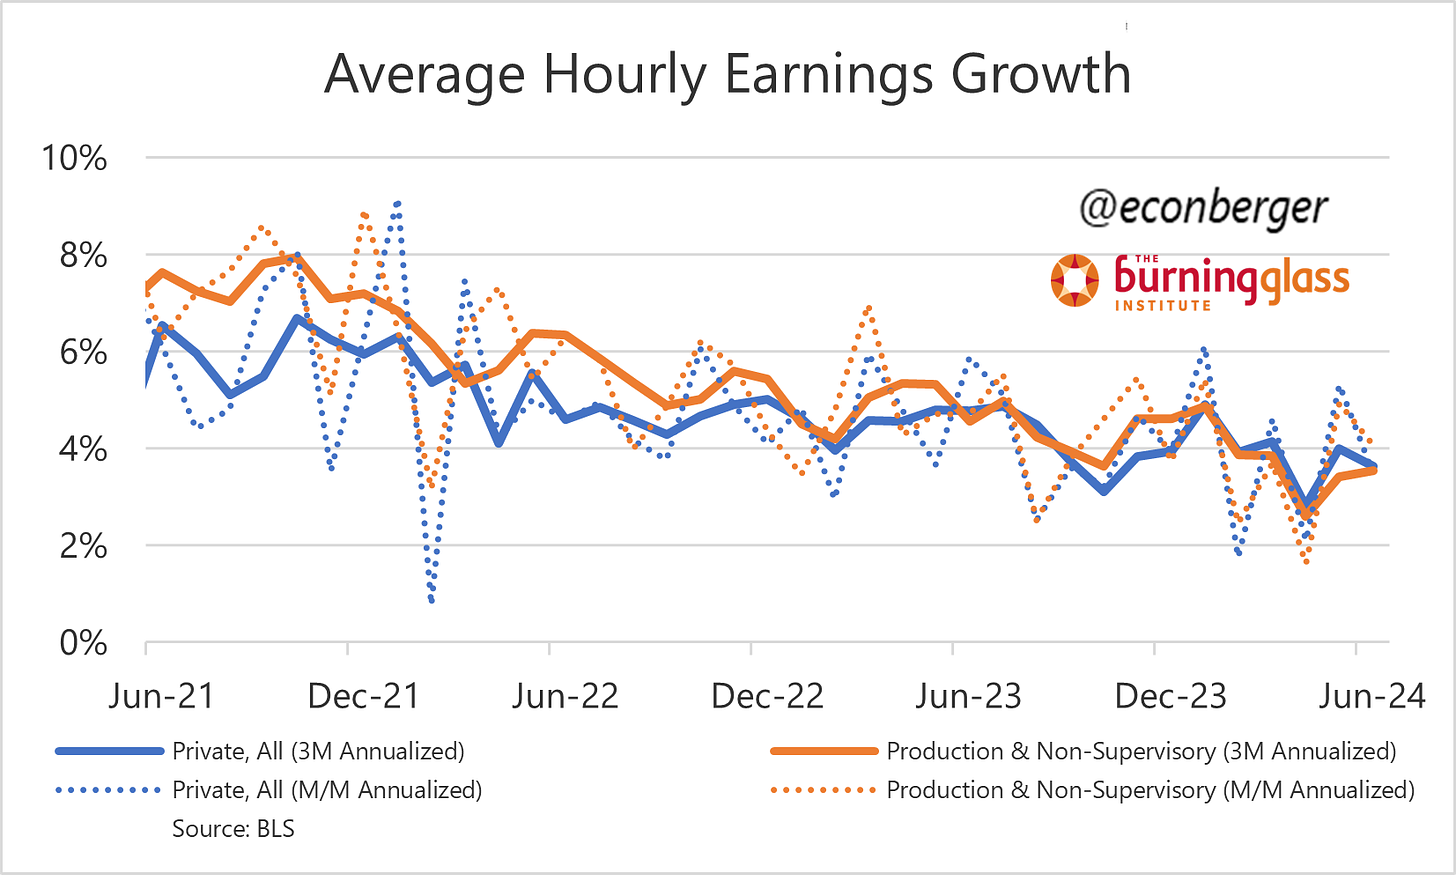
Wage growth: ~3.5-3.6% annualized over the past 3 months (good from the Fed’s perspective)
Topics I’ll cover in this recap:
The Big Picture
Revisiting Tipping Points
Employment vs. Unemployment
Other Data
Wage Growth
1. The Big Picture
Before anything else:
The labor market is experiencing a non-recessionary cooling (as it has been since the spring of 2022).
We’re not at the tipping point into recession yet, but I don’t have a lot of confidence about the distance from that tipping point.
And if you’re the Fed and look at this report, on the margin you’d be a little more inclined to ease more/sooner.
2. Revisiting Tipping Points
I spent most of my jobs report preview talking about nonrecession-to-recession tipping points and why I didn’t think one was imminent. But I also outlined what would lead me to change my mind, and it’s worth re-evaluating today’s data with that perspective in mind. And my conclusion is while that tipping point is probably still not imminent, we’re a little closer to it.
I mentioned that steady further increases in the unemployment rate would worry me. Well, we took another step up in June, to 4.1%. This was the most concerning part of Friday’s report. I would really like to see this series take a breather!
Additionally, though nonfarm payroll employment was solid in June, we had fairly large (>100K total) downward revisions to the prior months. The 3-month moving average of payroll employment gains fell to 177K in June, the lowest since early 2021. This isn’t a bad number by any means, but continuing this trend for 3-4 more months in tandem with rising unemployment would be problematic.
But one major indicator didn’t budge: the share of prime-working-age Americans stayed put at 80.8%. I’ll talk more about this shortly, but until we see a decline in this metric it’s hard to get too worried.
3. Employment vs. Unemployment
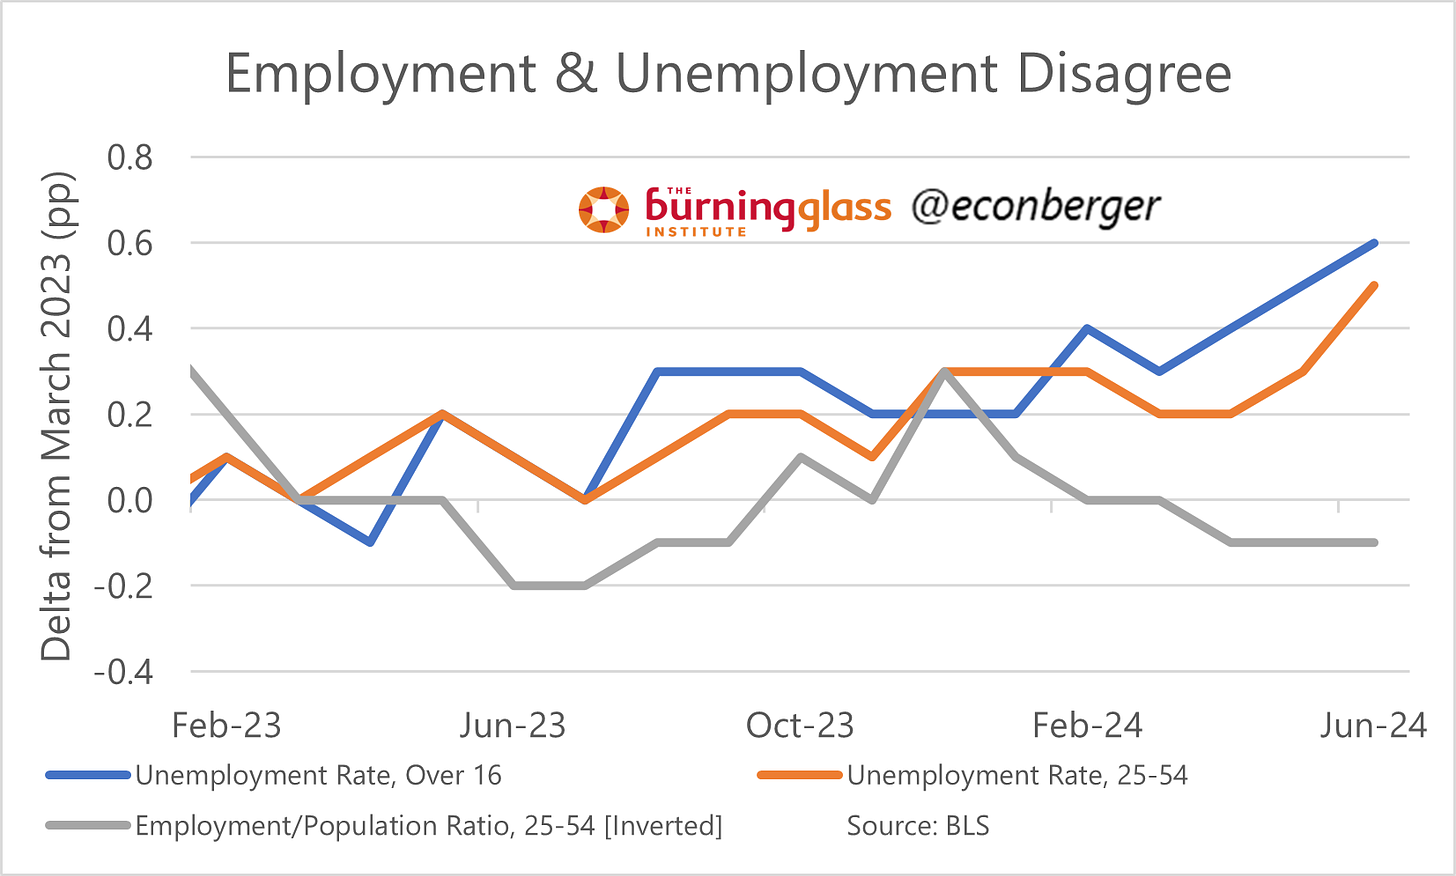
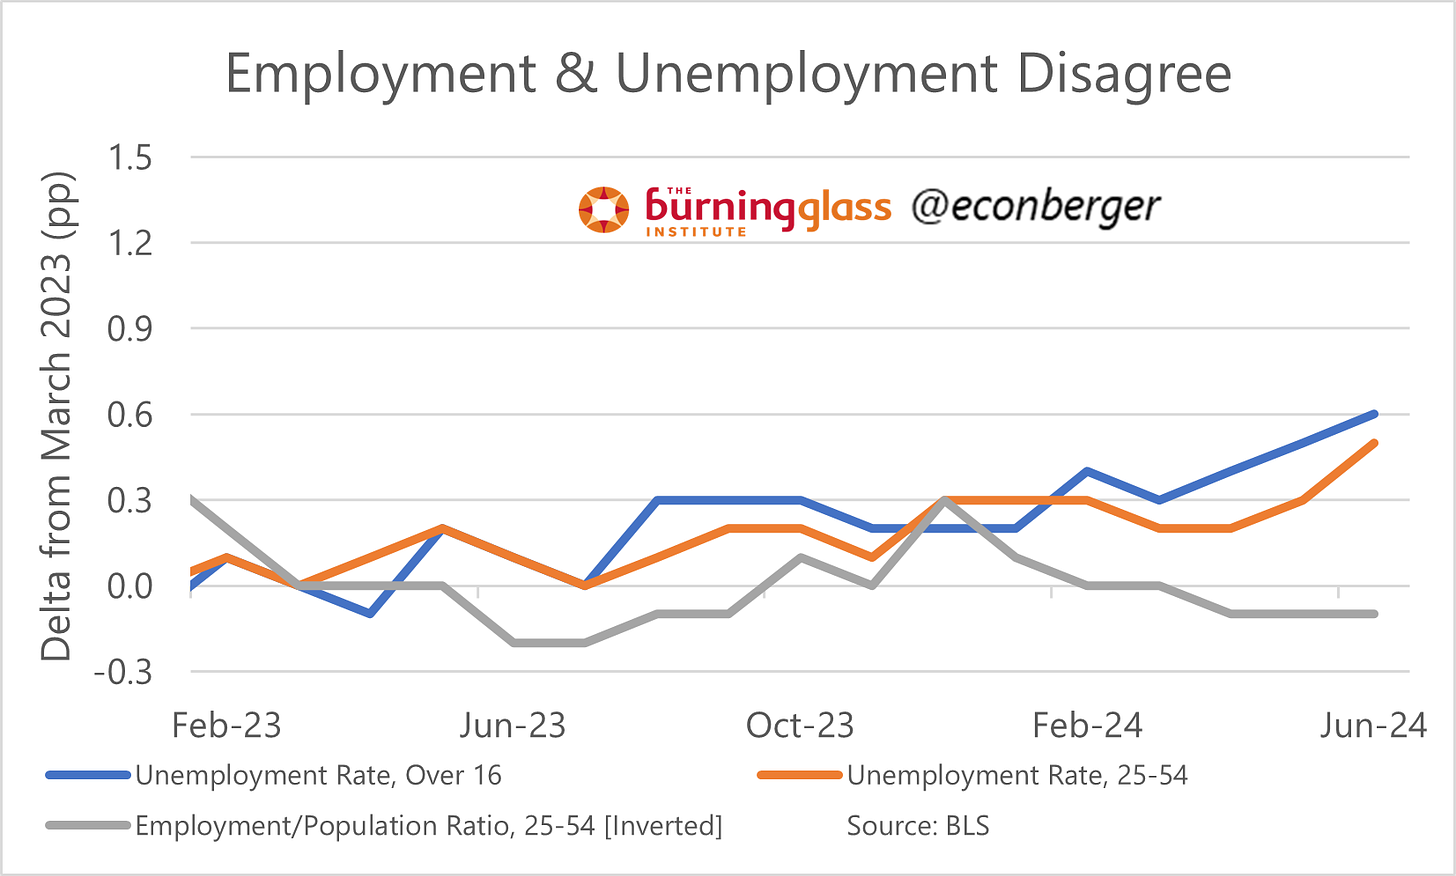
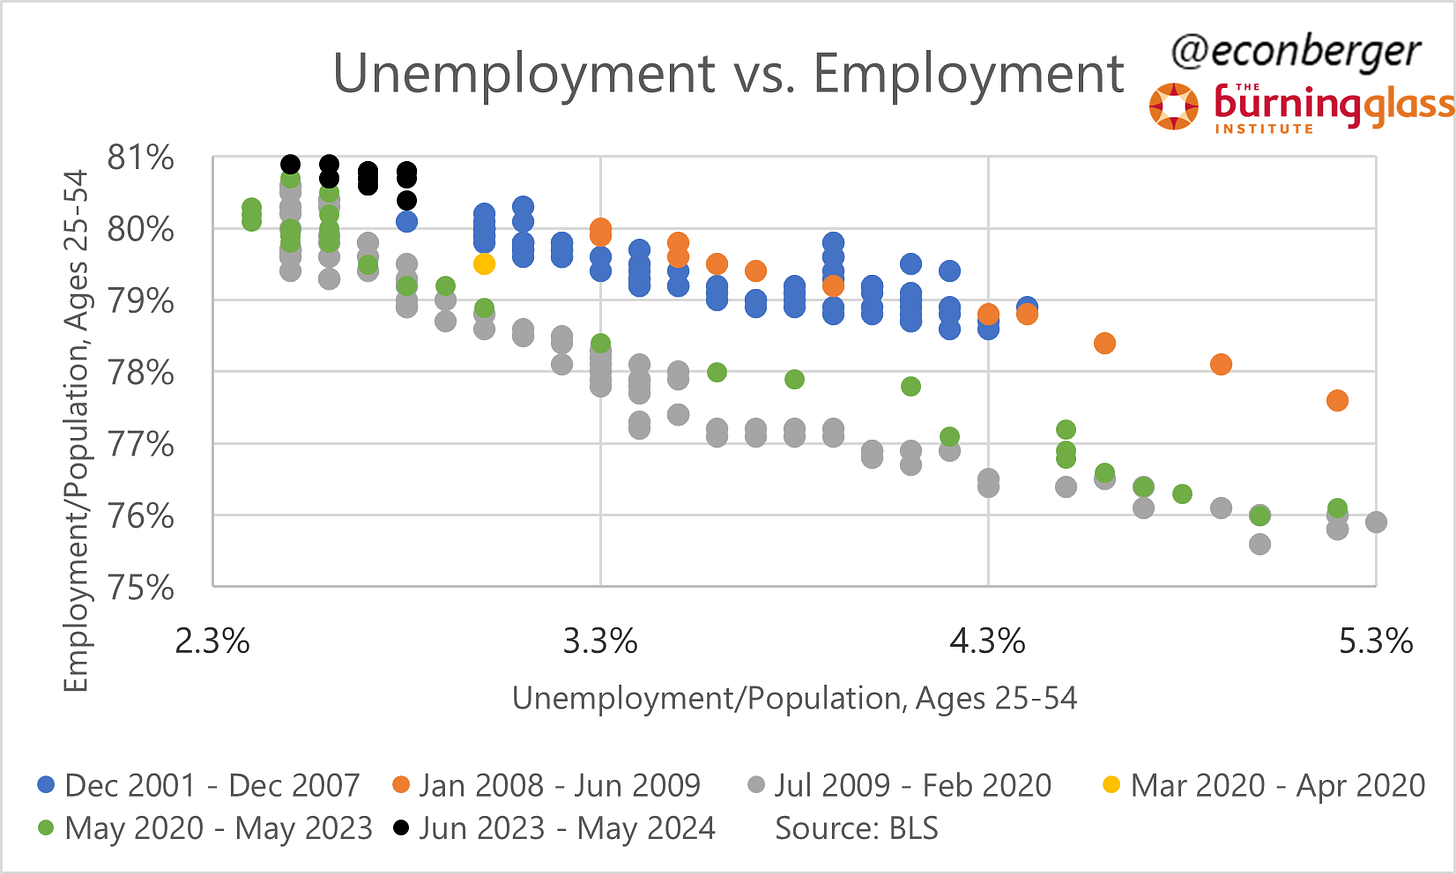
This cycle has been unusual in lots of ways, and one of them is the divergence between unemployment and employment since the spring of 2023. Unemployment has gone up by a fairly large amount since then: 0.7 percentage points for the overall measure, and 0.5 percentage points for prime-working-age unemployment. But as stated above, we’ve actually seen a modest increase in prime-working age employment over the same period.
This isn’t without precedent. Historically the relationship between employment and unemployment has shifted at times. The mid-2000s were a time of relatively elevated active job search; the 2010s were not.
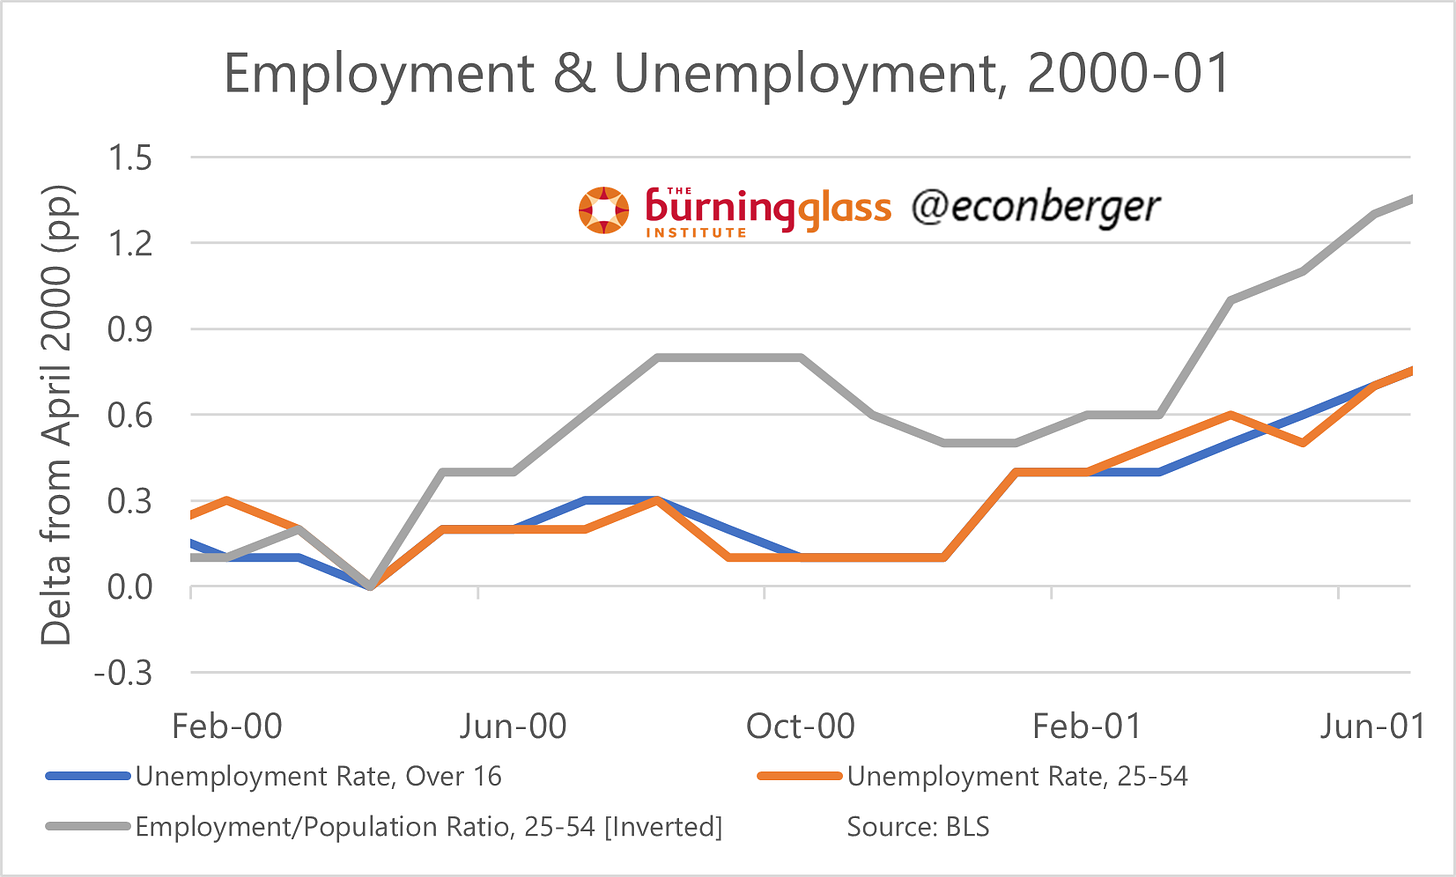
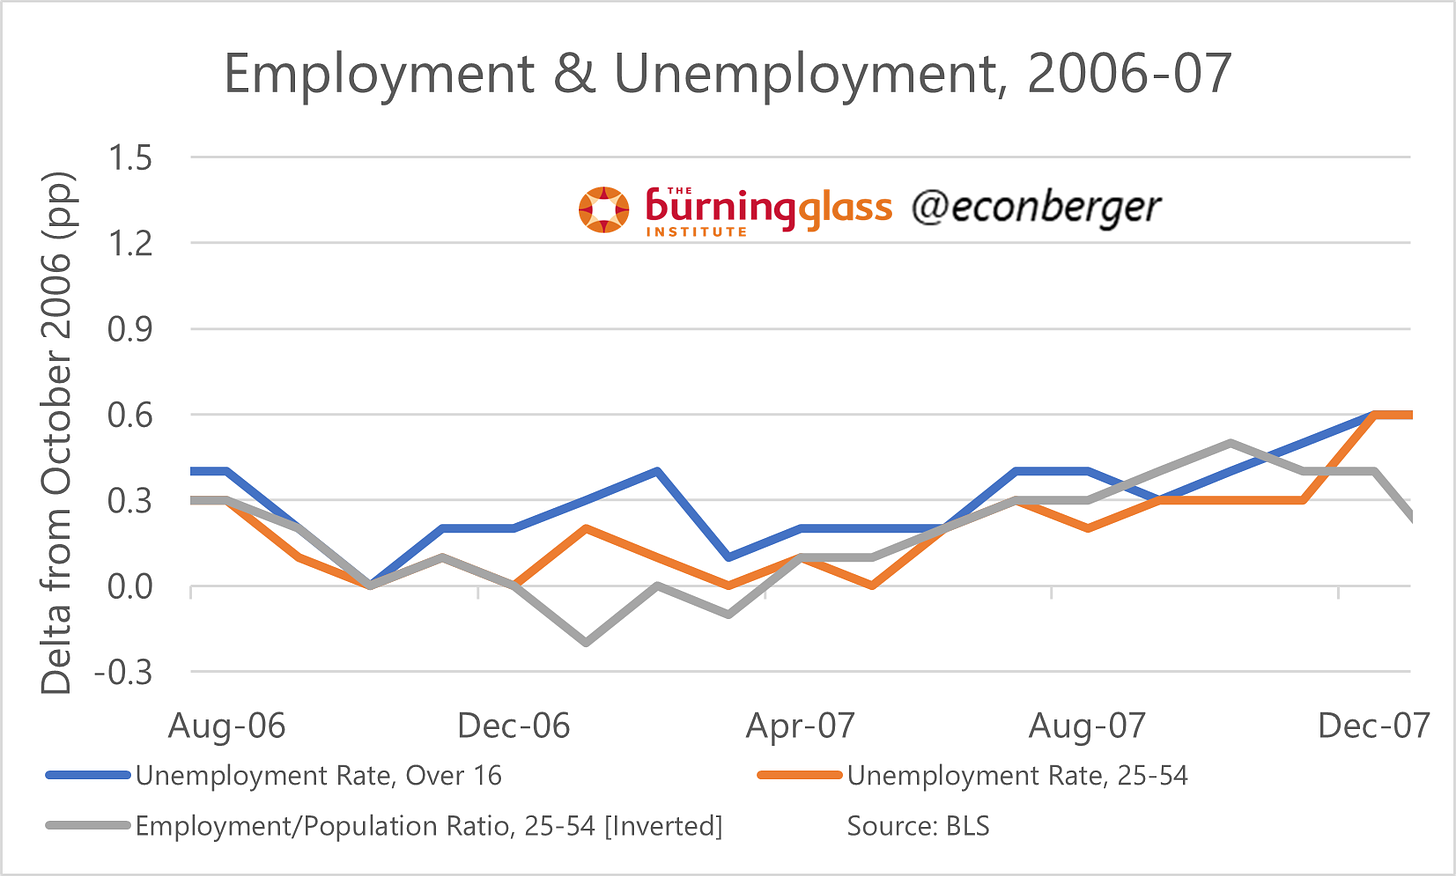
But prior to the 2001 and 2008-09 recessions, employment and unemployment were telling consistent messages - both were getting worse. This time is different.
Unlike in 2000-01 or 2006-07, the increase in job search activity among the non-employed isn’t the result, on net, of falling employment. I don’t have a rock solid explanation here - maybe this is the outcome of recent immigrants looking for their first job, maybe people have concluded from half a decade of very strong labor markets that job search is more worthwhile than they believed in the 2010s - but it’s hard to be that downbeat about it.
4. Other Data
The data in the tipping point section was a mixed bag; so it goes with the rest of the report.
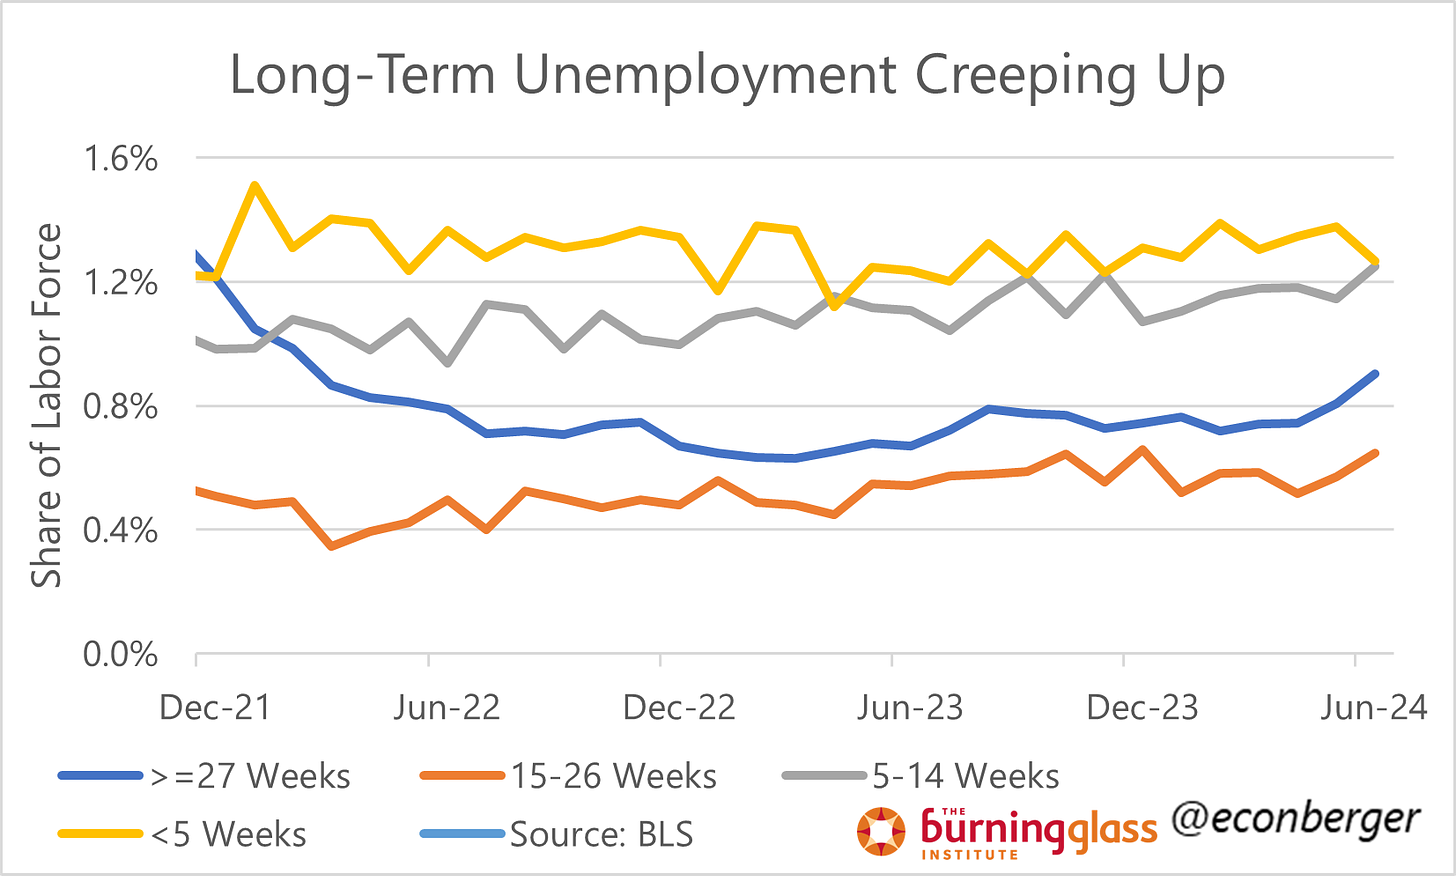
If you like to look on the dark side of life, you probably noticed that the share of the labor force that is long-term unemployed has moved up sharply over the past 2 months.
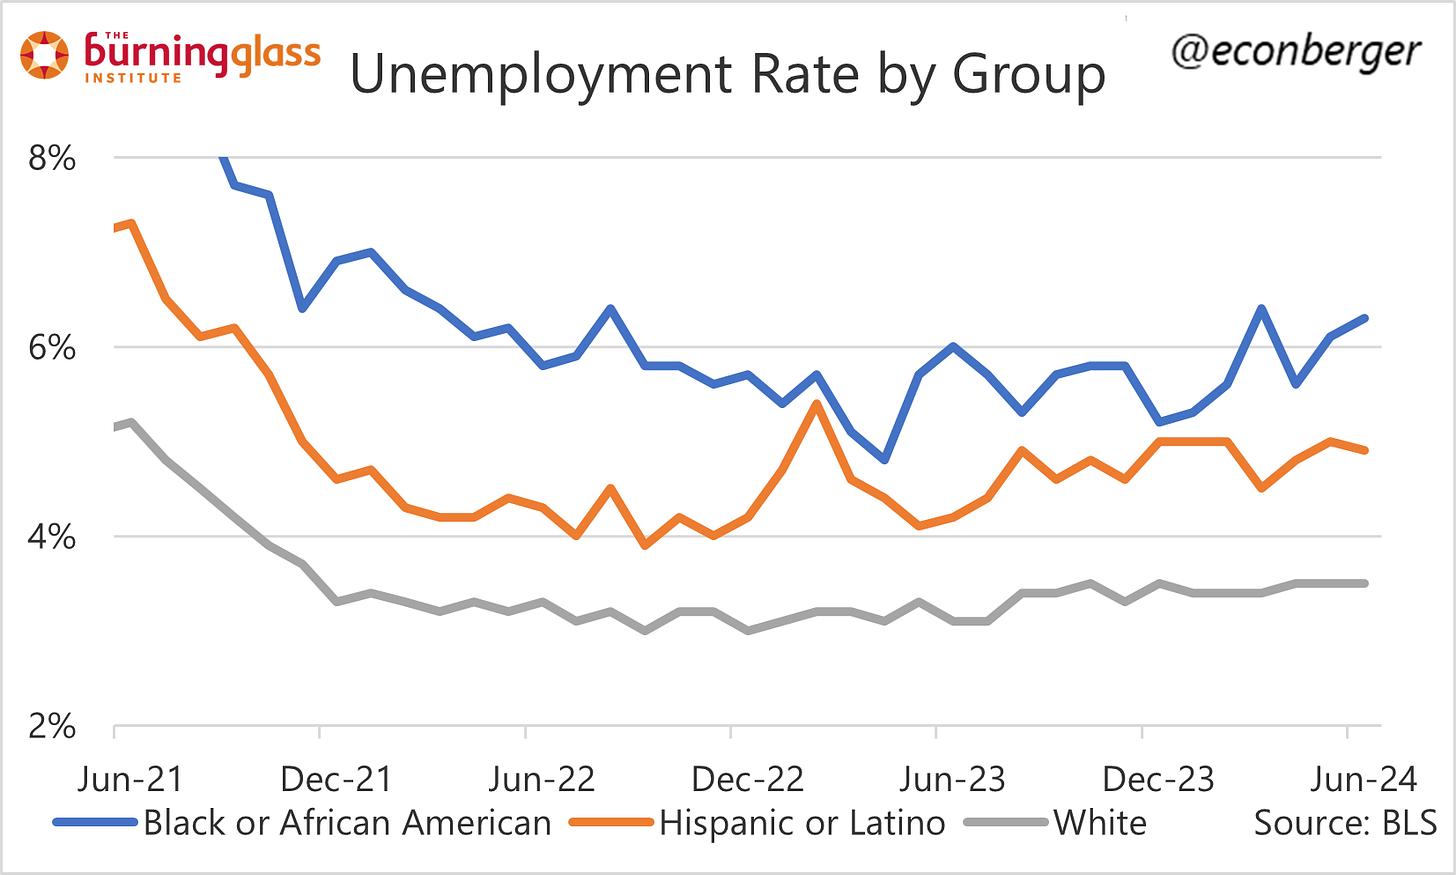
The unemployment rate of African Americans has also been trending upward. (Not obvious the trend for White or Hispanic Americans is different, but the amplitude makes the ascent much clearer for AA.)
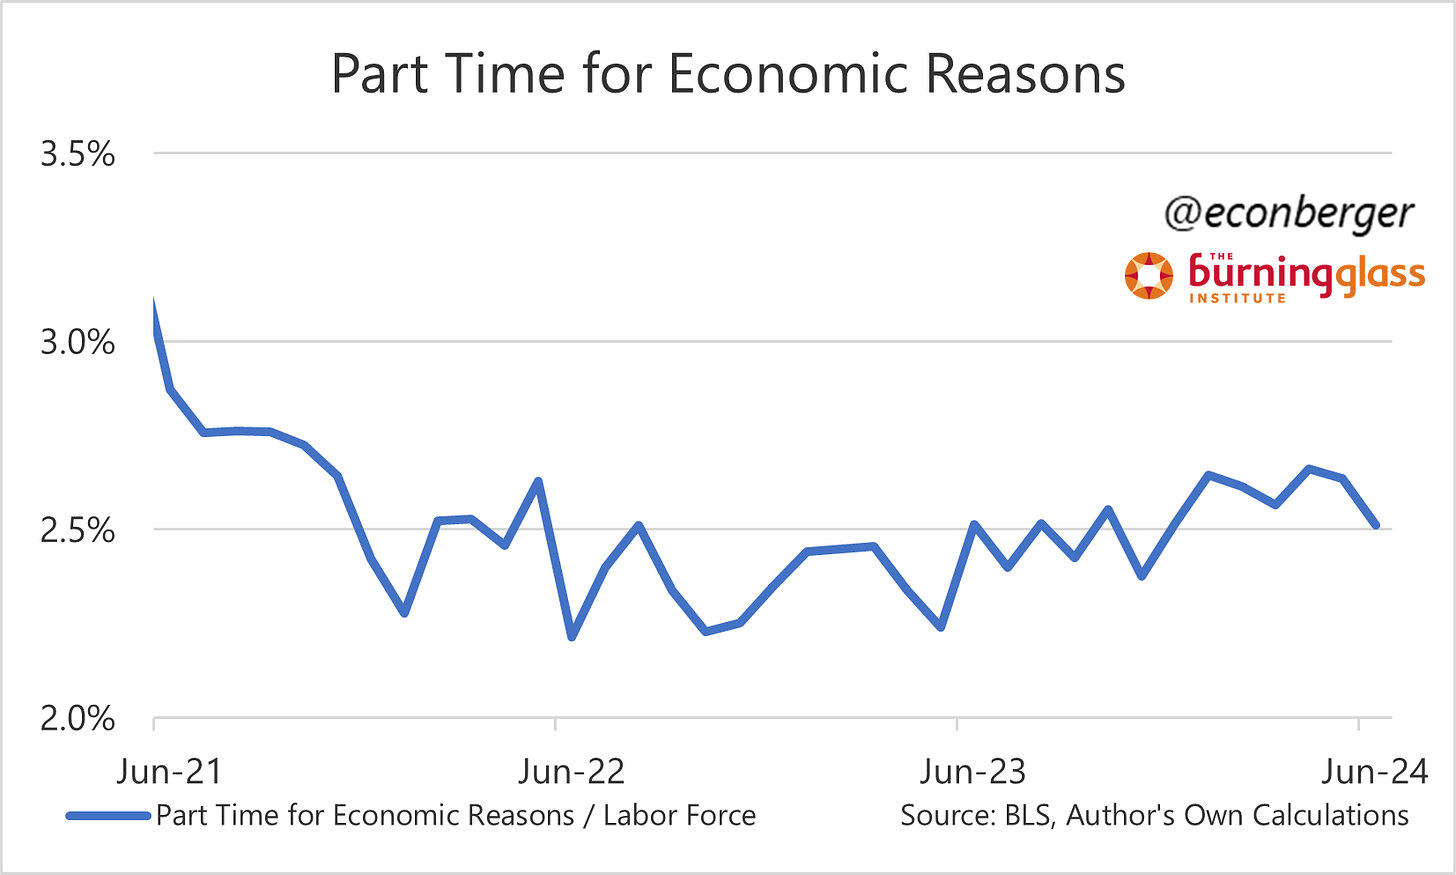
On the bright side, there were also a few other indicators I would expect to see adverse movement on in in tandem with rising unemployment, but instead improved. For example, the share of the labor force working part time for economic reasons (people who want a full time job but can’t find one) fell a little in June.
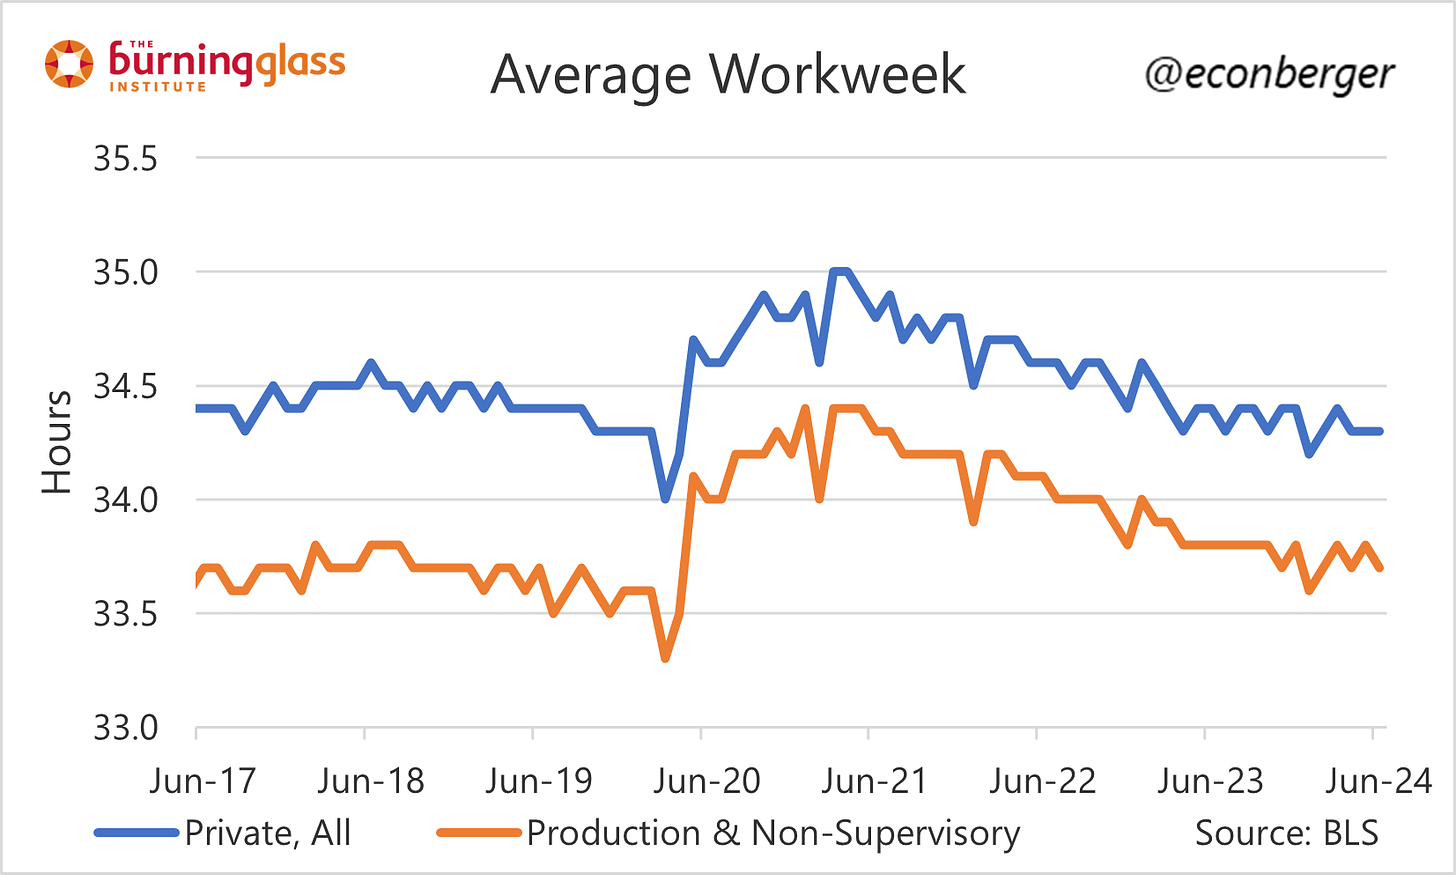
Average weekly hours are also fairly stable right now.
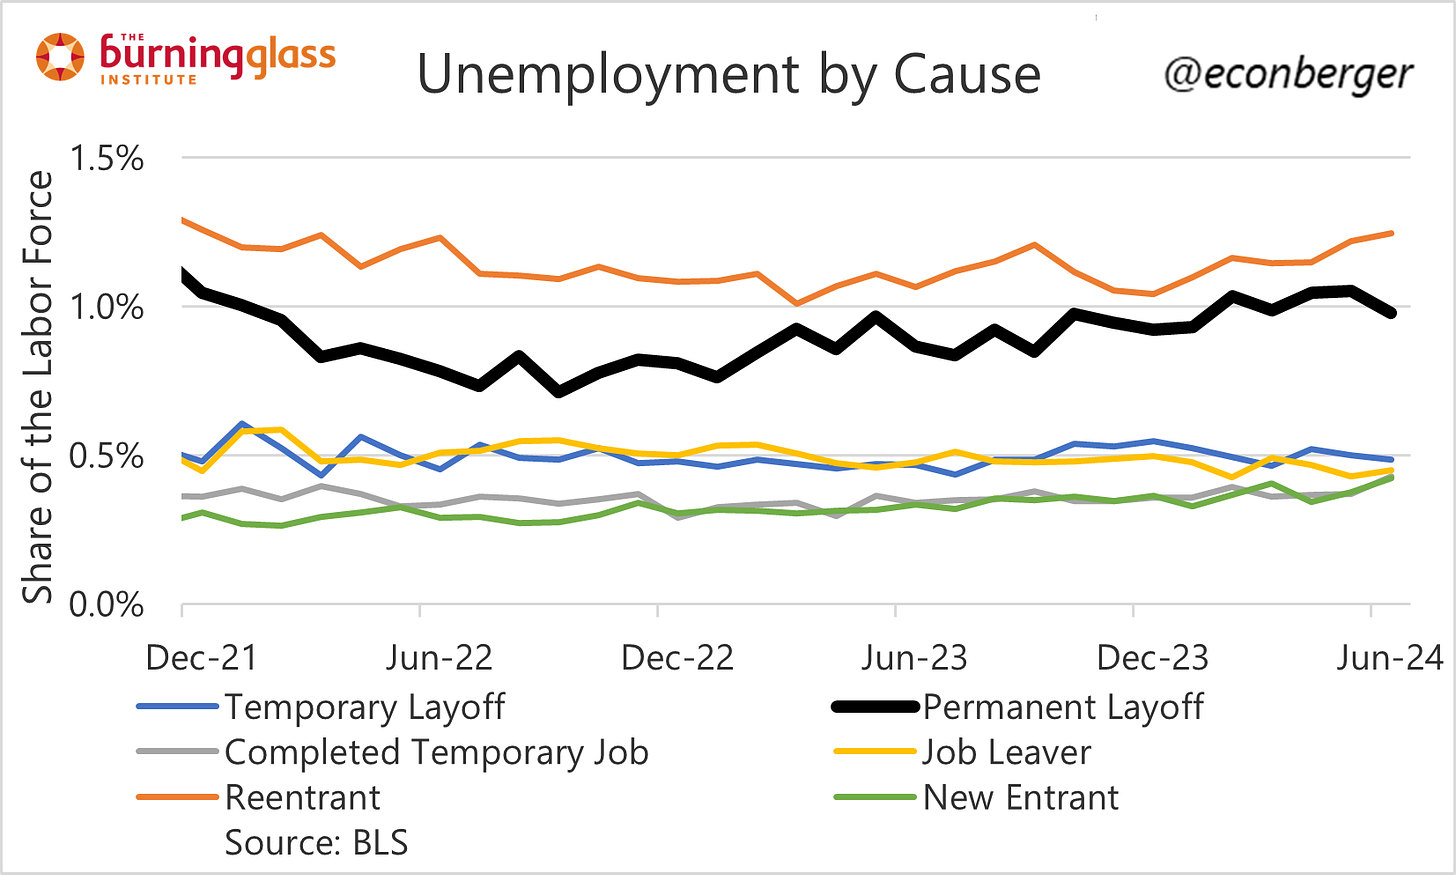
The composition of unemployment also improved - the share of people who are unemployed due to permanent layoff fell. New entrants and re-entrants to the labor force account for almost the entire increase in unemployment during the first half of 2023. (About 0.27 percentage points.)1
5. Wage Growth
Somewhat orthogonally, the data on wages has been within the Fed’s comfort zone.
I’m pretty skeptical about labor markets being a big driver of inflation fluctuation over the past few years, so the amount of marginal optimism I get from this wage data is low. But the Fed cares about this, and coupled with some of the other data in this report, is probably a little closer to a first rate cut over the next few months.
A pessimist would argue maybe some of the re-entrants are folks who lost their jobs and have exhausted their savings.


