


BLS Jobs Report Preview (May)
A mild weakening in the cards?

TL;DR: May’s job data may show signs of renewed weakening in the US job market.
The rest of this preview is split into:
The Big Picture
Lower Labor Supply Growth Will Confuse Us
The QCEW and Future Downward Revisions
More below chart.
1. The Big Picture
We’ve been waiting and waiting and waiting for the jobs data to soften in the wake of the April 2nd tariffs. It didn’t happen in the April jobs report, but I think we could get a taste of it in May’s.
We’ve gotten a few hints from other data that the labor market cooled a little last month. The increase in continuing claims has accelerated a little; ADP reported piddling job gains in May; the Conference Board indicated that consumers believe jobs became less plentiful and a little harder to get. That said, there’s a reason I picked the word “softened”, instead of “weakened” in the prior paragraph.
The deterioration in continuing claims is small (at least so far). ADP is not great, but not terrible, and we’d expect smaller numbers than last year solely on the basis of weaker labor supply growth (see next section). If you look at the biweekly Business Trends and Outlook Survey published by the Census Bureau, there’s been no deterioration in firms’ headcount actions (though their plans for the future remain downbeat).
So if we see a softening this month, I think it will be incremental rather than precipitous. And that goes for future months too; the tariffs, to the degree they are not offset by tax cuts, will sap the economy’s strength gradually.
2. Lower Labor Supply Growth Will Confuse Us
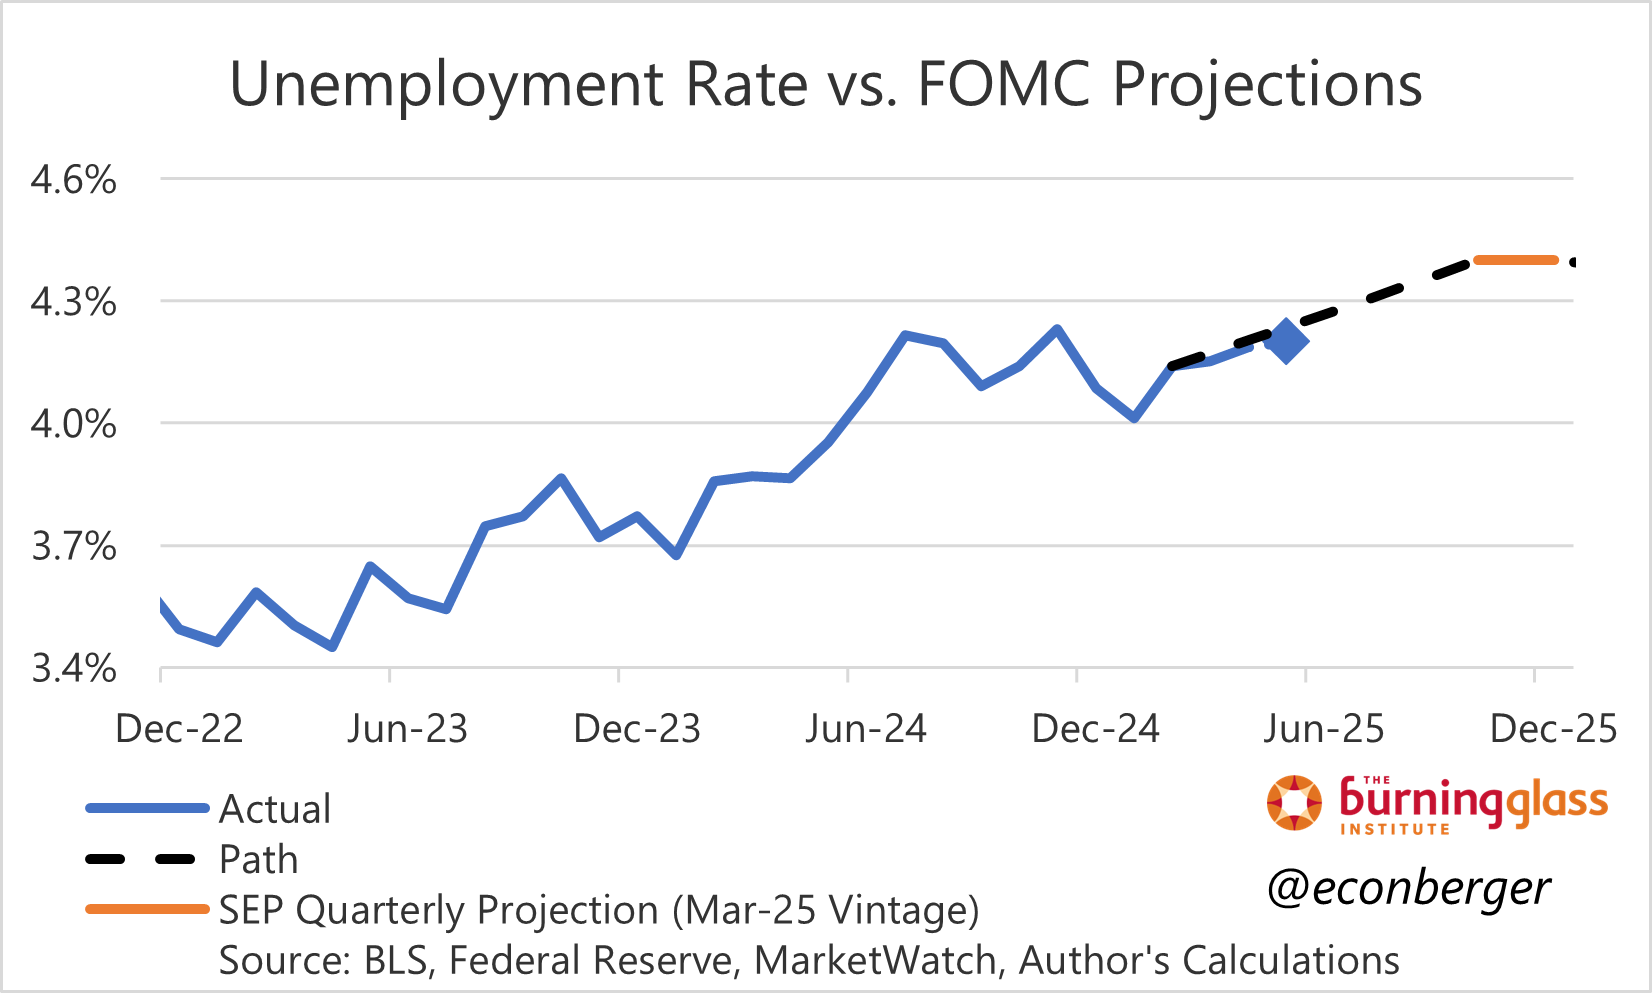
In early 2024, we were staring a big labor market mystery: job growth accelerated even as the unemployment rate rose and hiring rates declined. The explanation for that mystery was a big supply side surge driven by immigration. The break-even rate of employment growth for labor market “thermometer” metrics like unemployment and turnover had risen.
We’re now experiencing the reverse. Immigration began slowing sharply in the latter half of 2024, and the current administration is likely to squeeze it further. (If mass deportations occur, it may even turn negative.) So breakeven employment growth has fallen.
We can already see this happening in the data. Between October 2023 and July 2024 the unemployment rate went up by 35 basis points; from July 2024 through April 2025 it’s been basically flat. But currently-reported employment growth has been slightly lower in the latter period; taking future revisions into account (see the next section), employment growth has slowed more than “slightly”.

When slack was rising in tandem with strong employment growth, I argued that calling the job market “hot” or “strong” didn’t feel right. The reverse is also true - if we see job growth decline without a corresponding increase in the unemployment rate or decline in turnover rates, we should avoid saying “the labor market is worsening”. It will be really confusing.
3. The QCEW and Future Downward Revisions
For almost as long as I’ve been writing this newsletter, I’ve been writing about the Quarterly Census of Employment and Wages (QCEW). The QCEW is an interesting data set with its own intrinsic merits, but its best-known application is as a benchmark for the Current Employment Statistics (CES, aka the “establishment survey”) from which we derive essential high frequency data like nonfarm payroll employment. Those data are priceless, but they do occasionally drift off track with over- or undercounts due to business creation or destruction. The QCEW helps them get back on track.
Once a year, the CES undergoes a revision that includes benchmarking the prior year’s March employment level to (primarily) the QCEW. The next such revision will occur in early February 2026, and will apply a new QCEW-based benchmark to the March 2025 employment level. We’ll have a preliminary estimate of this benchmark in September 2025 once the BLS publishes the first iteration of March 2025 QCEW data.
As of today, we’re 3 quarters of the way there. The BLS has released QCEW data through December 2024. Historically, these “3/4 of the way there” QCEW data have been reasonable predictive of the eventual benchmark revision - if the CES is overcounting 3/4 of the way through, we should expect a negative benchmark revision.

Well, currently the CES overcount is very large: 907,000. If taken literally and stretched out over 12 months, it suggests we should shave off about 75,000 per month from post-March-2024 employment growth - that’s almost half of what’s currently estimated!
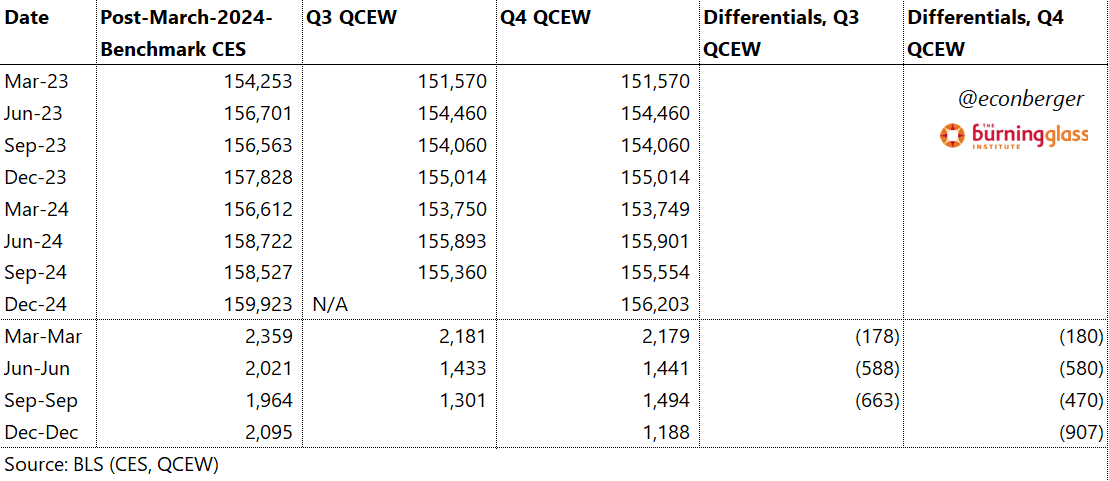
Before you panic, a few thoughts. The first is that generally benchmark revisions have been somewhat more optimistic than these 3/4 of the way through estimates, by about 120K on average. So my baseline (with wide error bands) for the eventual benchmark is around -787,000, or 65,000 per month. That’s still pretty hefty!
Second, for this specific quarter (Q4), the QCEW count (and therefore the Y/Y gain) is likely to be revised up by about the same amount.

Third, the QCEW affects the CES but not the other major survey in the monthly jobs report, the Current Population Survey (CPS, or household survey). Those data are untouched by the benchmarking exercise and, at least in their ratio form, relatively immune to revisions. The household data ratios have been relatively steady since last summer, an assessment that is not going to change meaningfully over time. So I’ll express a partial “so what” if employment growth ends up being weaker - we already know the “result”.
“So what” is a little glib - the pace of employment growth matters for a lot of reasons, including GDP growth. But as far as labor market tightness goes, we can be mostly agnostic. We can have a cooling job market with strong employment growth, or a warming job market with weak employment growth. Trust in the ratios.