TL;DR: Bad news about the labor market is coming, but probably not on Friday.
The rest of this post covers two topics:
The Big Picture
Where to See Signs of Weakness
More below charts.
1. The Big Picture
If you read my labor market analysis here on substack or elsewhere, you know I started the year optimistic but turned pessimistic - a turn that began in mid-February but significantly intensified after the infamous April 2nd tariff announcement. Households and employers agree that “something wicked this way comes” to the labor market in the future, and I think they’re reasonable to do so.
But mid-April is too early for labor market ugliness to unfold. Looking at some of our higher frequency indicators, there’s no sign of a break in trend through that point. Initial and continuing claims are were growing at a low-single-digits pace through the survey period, with no sign of a break in trend.1 The surveys are maybe showing a little cooling in employers’ and households’ assessments of the current labor market, but it’s incremental at worst. And if you look at the Indeed job openings data, we’re still in a very gradual downward glide path. That’s not great news, but it’s not terrible either; given a lot of the current worries, these trends’ continuation would be a relief.
Instead, it’s worth thinking of a gradual and intensifying ladder of events that eventually leads to bad outcomes. This will probably start in the transportation sectors - where activity is already slowing down - and perhaps import-sensitive manufacturing. I’d then expect it to roll into sectors like retail, wholesale and construction. And finally, probably due to a decline in consumer and business spending, we’d see a broader weakening in the labor market data.
As I wrote in my JOLTS recap, I’m not sure the outcome will be an outright recession (though risks of the latter are elevated); gradual and protracted labor market anemia (a la Brexit) can also lead to a diminished job market. And even recessions can take a long time to get going. We just might have to wait a little longer for that nasty ball to get rolling.
2. Where to First See Signs of Weakness
First off, if you’re not staring at the Indeed job postings and unemployment insurance claims data on a weekly basis, you’re missing two of our best early labor market indicators. Folks like to bash the claims data, but it’s been pretty good at catching the post-2021 turns in the labor market. And while initial claims are mostly a proxy for layoffs (a lagging indicator), continuing claims are also a function of hiring (a leading indicator).
Second, if you’re a casual consumer of job market data, you could do worse than just looking at the two numbers that dominate the headlines every monthly jobs report:
the unemployment rate
the monthly change in nonfarm payroll employment
The unemployment rate has the advantage of being nearly immune to revision, and it’s not a coincidence that it underpins Claudia Sahm’s famous rule. Negative employment growth is a pretty standard (though not universal) signal of economic downturns, leading TS Lombard’s Dario Perkins to joke about a “Perkins Rule”.
But let’s say you’ve done all these things and want to get into the “deep cuts” - those that will send the earliest signal. Where to go?
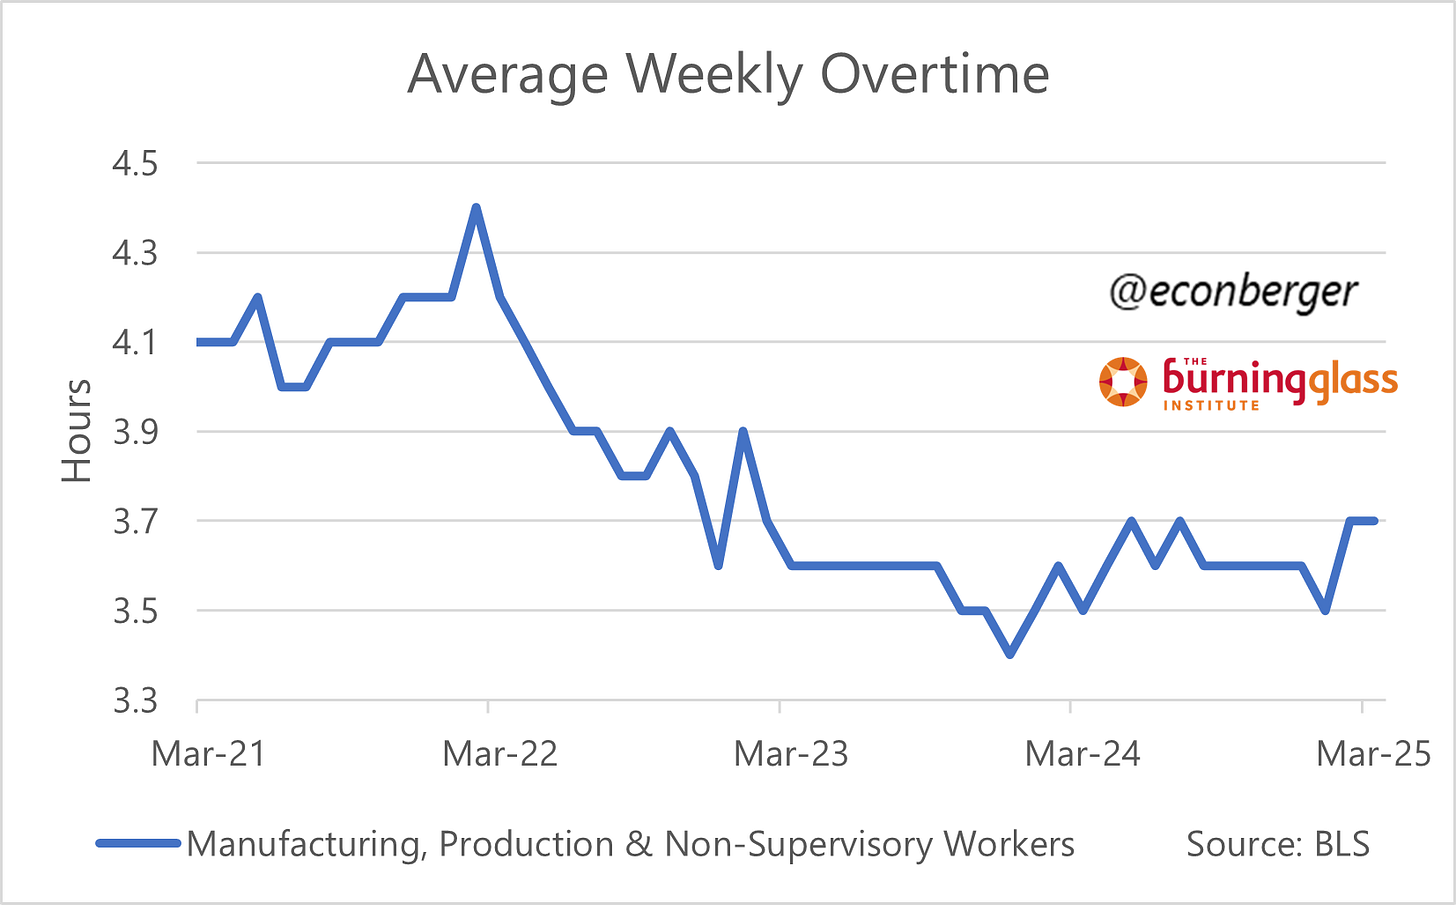
I think for starters, you’re going to want to focus on the sectors that are most likely to feel the initial impact from tariffs, and on reversible employment decisions that fall short of layoffs. In the monthly jobs report, that means the average workweek in transportation/warehousing and manufacturing. For what it’s worth, we’ve seen a recent pickup in hours in both industries that may indicate a temporary attempt to front-run the tariffs.
For manufacturing (but not transportation), we’re also fortunate to have average weekly overtime hours; these are more cyclically sensitive than overall hours:
Some motivated folks might be inclined to dig into the sub-industry data, but timeliness becomes an issue here. In manufacturing we have up-to-date weekly hours for about a dozen sub-industries (a selection is in the chart below), but in transportation we do not (data on the workweek for categories like truck or air transportation are released with a one-month lag). An alternate option for granular analysis in transportation & warehousing is looking at the level of employment (these are available in a timely fashion), but we’ve already discussed why employment is not quite as good as hours in terms of early effects.
If we see some of these indicators start to move in an adverse direction in the coming months, we’ll probably want to broaden this net to retail and some other industries. I’m open to other ideas!
There was a big spike in initial claims and a smaller spike in continuing claims later in April, post-dating the reference period for the April jobs report. And at least in the case of initial claims, it appeared to be a false alarm driven by New York State rather than more fundamental weakening.


