I’m publishing 3 pieces this week: a JOLTS recap (here), a BLS jobs report preview (this one), and a BLS jobs report recap (Friday).
TL;DR: The labor market’s expansion continued in December. I’ll be looking for more evidence that labor market cooling is “done”.
This preview is structured as:
The big picture: Goldilocks takes a nap
Nonfarm payroll employment
The unemployment rate & prime working age employment/population ratio
Wage growth
Miscellaneous indicators
More below charts.
1. The Big Picture: Goldilocks Taking a Nap
After last month’s jobs report, I tweeted:
The reason that November’s report was boring: most data points within it were telling a consistent story of moderate improvement in the labor market. Moreover, indicators like the unemployment rate, which in prior reports had been flashing amber about the health and durability of the expansion, turned greenish again.
I don’t anticipate much of a change in the December’s report. Indeed, if we remain lucky on inflation, we’re due for a lot of boring, predictable job reports this year: moderate job gains, moderate wage growth, low unemployment. Call it a 'Goldilocks takes a nap' labor market.
If we’re not lucky on inflation - well, the Fed will keep squeezing the labor market, pushing employment gains down and unemployment up. Let’s hope that doesn’t happen!
2. Nonfarm Payroll Employment
Forecasters anticipate that nonfarm payroll employment increased by 170,000 in December - a solid increase that’s slightly below the pre-COVID trend.1 If that forecast materializes, it would land us at an annual increase of 2.72 million for all of 2023. But this was a year of two halves: 1.54 million in the first half, 1.18 in the second. During the first half employment gains continued the gradual downward glide that began in late 2021. But around mid-year that deceleration stopped, and we’ve been chugging along near 200,000 per month since then.
The disappointing JOLTS data on hiring and quits gives me a little pause - it’s “all of November data”, so is a tad more timely than the November jobs report data we got a month ago (which ran from mid-October to mid-November). Maybe some of that weakness will “leak” into the December nonfarm payrolls delta (which corresponds to the mid-November to mid-December period). But that’s pretty speculative, and we don’t see any additional signs of weakness in the super-timely jobless claims data.
It’s worth talking is about revisions in the establishment survey data. We’ve averaged initial revisions2 of -41K to the first nine months of 2023 (the 9 months for which we have 3 vintages of data). I suppose it’s possible this will continue (see Martha Gimbel’s note), though if I’m right and the labor market is close to stabilizing, those should converge to zero at some point.
Regardless, the concept-adjusted household survey suggests the establishment survey count is roughly correct - i.e. there’s no reason to believe nonfarm payrolls are overstating employment growth.
3. Unemployment & Employment
Forecasters expect the unemployment rate ticked back up to 3.8% in December, a little bit above November’s 3.7% but below October’s 3.9%. If it materializes, it would imply a 0.3 percentage point increase in the unemployment rate over the course of 2023.
Since folks are razor-focused on the possibility of the Sahm Rule being triggered at some point, it’s worth noting the threshold in December would be an unemployment rate of 4.4%. I really doubt it’s getting triggered this month. Moreover, if the labor market really does stabilize, I expect there’ll be a ceiling on how much unemployment goes up - in fact, I would bet the recent increases reverse over the coming year.
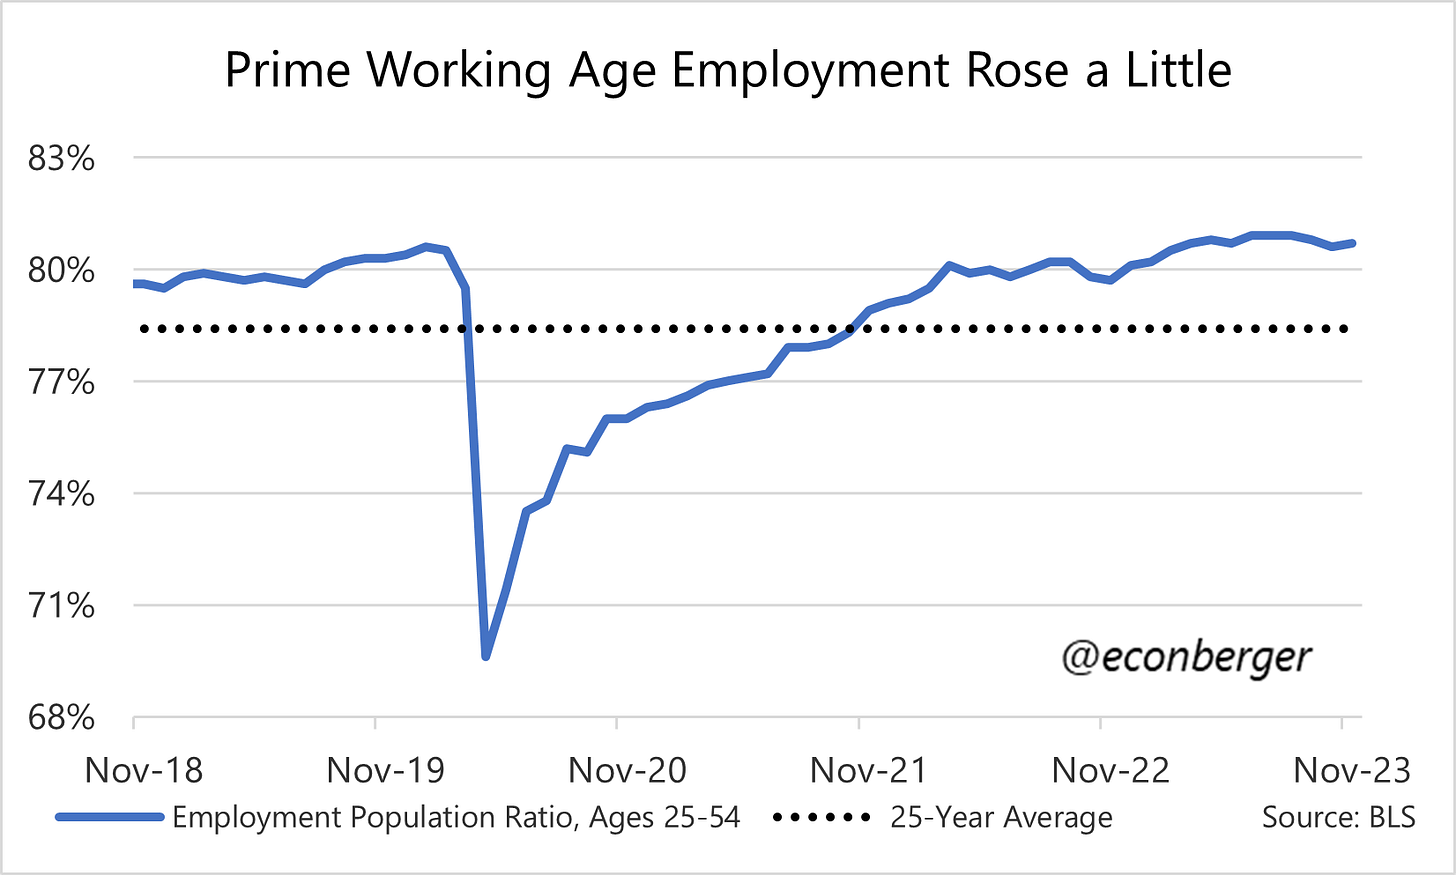
I’ll be looking closely at the prime-working-age employment population ratio too. This dipped in the early fall and partly rebounded in November - at 80.7%, we’re 0.2 percentage points shy of the post-2001 high, and 1.2 percentage points shy of the all-time high (April 2000). If I had to bet, we’ll hit a new post-2001 record in 2024, but probably not reach the all-time high.
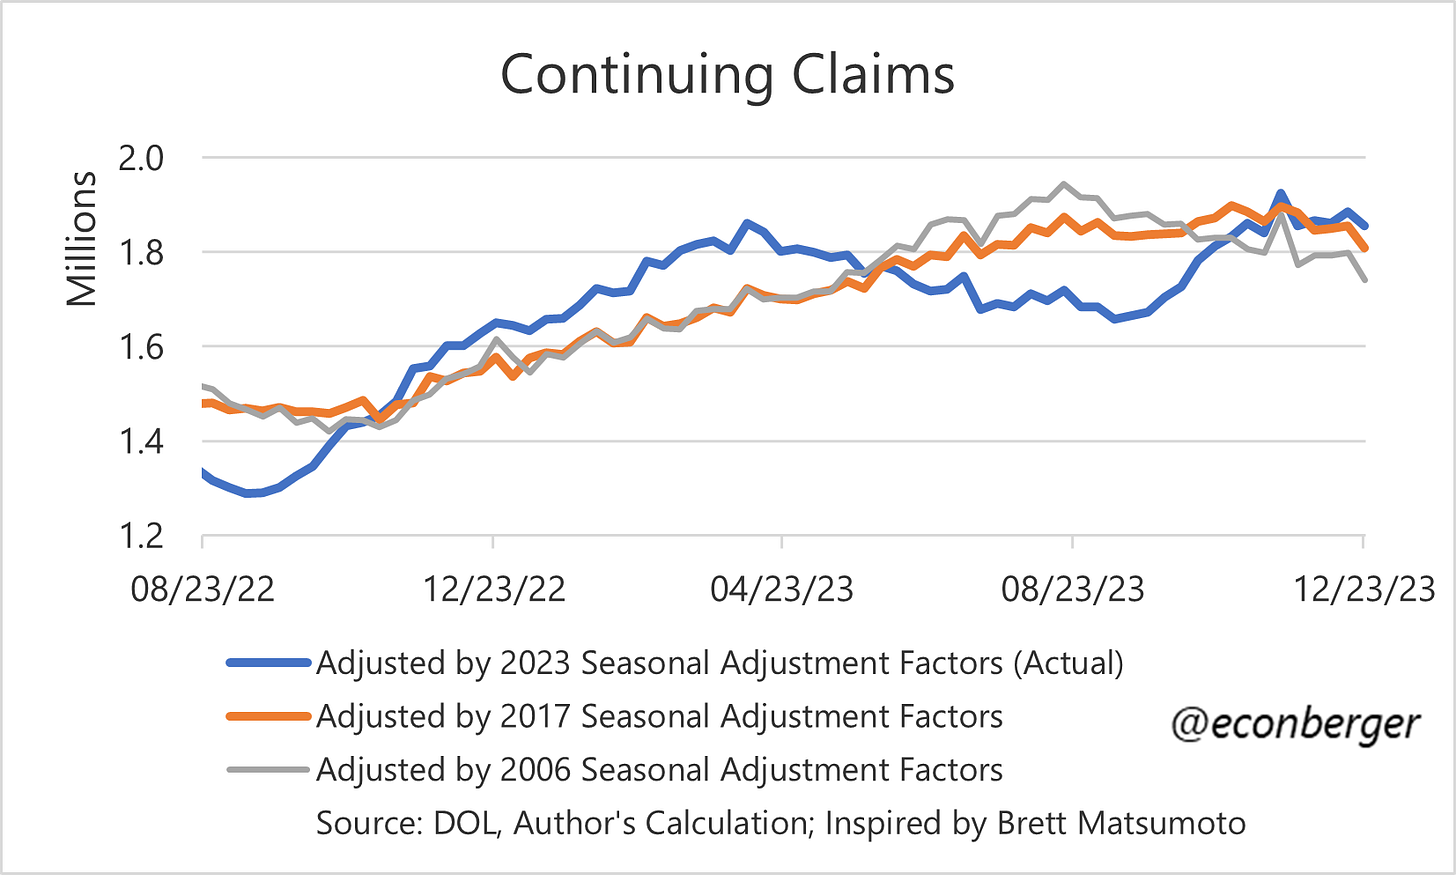
One idea I’ve been throwing around is the possibility that seasonal adjustment is funky in the household survey data (including the unemployment rate and employment/population ratio). In the fall of 2022, we saw a brief patch of weak data in the fall before a renewed improvement trend in winter and early spring 2023. It’s possible this is happening again (low confidence hypothesis):
A final note on the household survey data: we’re getting new seasonal adjustment factors - this will impact unemployment, the employment population ratio, and labor force participation (but not nonfarm payrolls or wage growth, which come from the establishment survey. Historical revisions to the household survey data tend to be small and non-material.
3. Wage Growth
In his December press conference, Fed Chair Powell said:
“Wages are still running a bit above what would be consistent with 2 percent inflation over a long period of time. They’ve been gradually cooling off. But if wages are running around 4 percent, that’s still a bit above, I would say.”
On a year-over-year basis wages are indeed running around 4%. On a 3-month annualized basis, pay growth has been closer to 3% than 4% for all private sector workers (and a tad above 4% for non-managerial workers). I think the November data was somewhat fluky, though, and bet that in 3-6 months we’ll be consistently below 4%, making the Fed happy.
Additionally, if inflation really does converge to 2%, we’ll still see real wage growth between 1% and 2%!
5. Miscellaneous Indicators
Unemployment due to permanent layoffs:
I sometimes get questions like “why is BLS not capturing the layoffs we keep hearing about?” Well, for starters we just haven’t had many layoffs!
But the small amount of layoffs we’ve had did push the share of unemployed due to permanent layoffs upward by about 2 tenths of a percentage point. The claims data suggest this is unlikely to go up in December’s BLS report. I’m hoping at some point we see it go back down.
The Average Workweek: This has been flattish since early 2023. For the average private sector worker this has normalized; but it’s still elevated for the subset of workers who are non-managerial.
Part Time for Economic Reasons: Another household survey indicator that looked soft in early fall but improved in November.
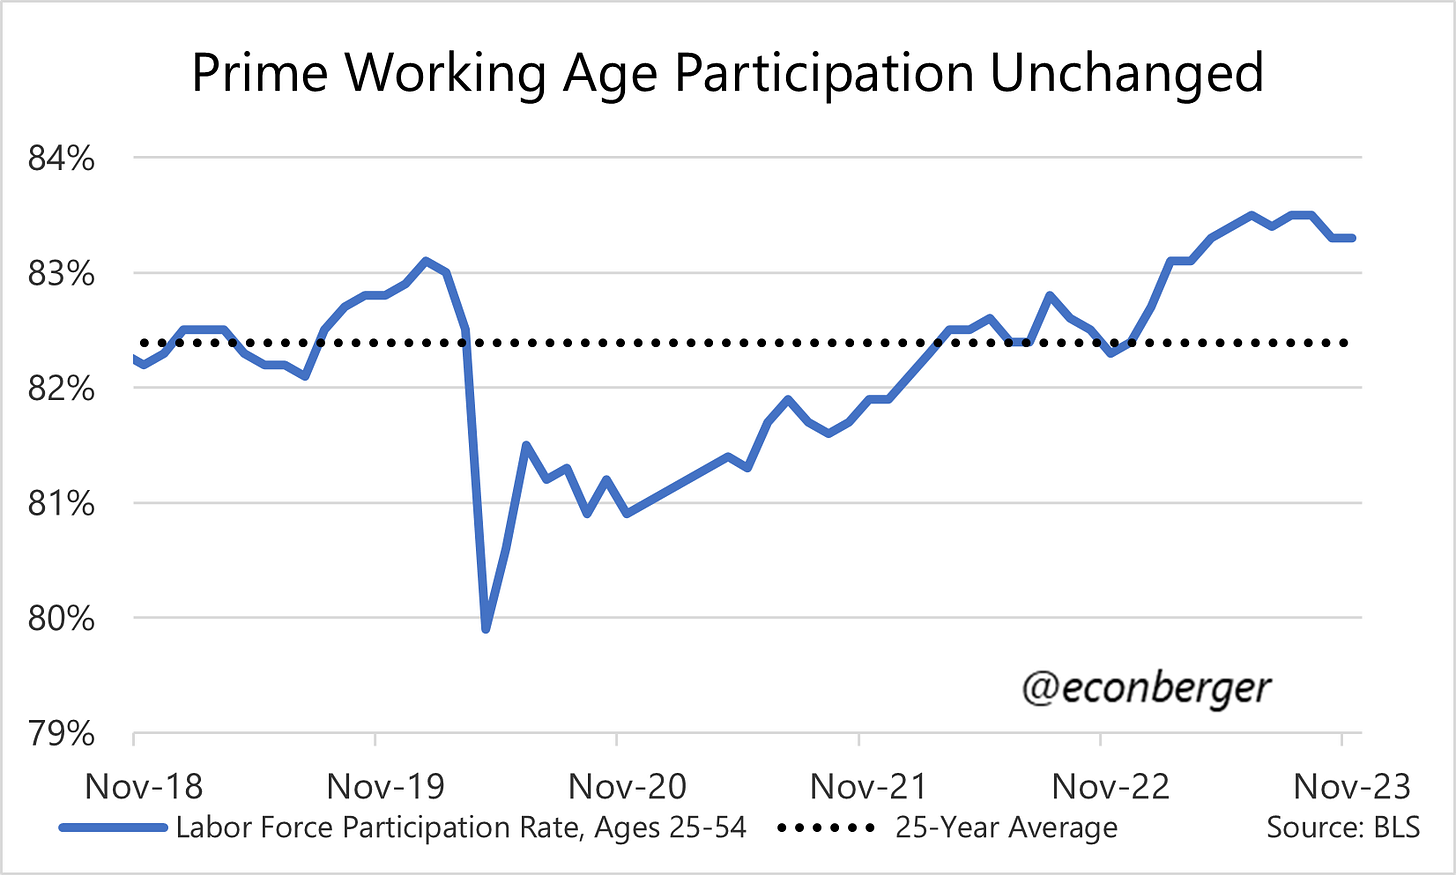
Prime Working Age Labor Force Participation: I think of this as an inferior metric to the prime-working age employment/population ratio, but it’s showing roughly the same pattern (with less amplitude).
Unemployment rate for Black and Hispanic Americans: Both of these are up from the spring. Hopefully we see renewed improvement!
Given American demographics, at some point we’d expect these gains to slow substantially if the labor market is moving in the right direction. But barring a sharp slowdown in immigration, December 2023 probably isn’t the month for that “supply side slowdown” to kick in.
That is, revisions that come in during the first three vintages of the data. There are further, often more substantial, revisions that come in during the annual benchmark revision.


