
Preview of the 2025 Preliminary Benchmark Estimate
Bad news about the past

TL;DR: On September 9th at 10 AM ET, we’ll get “old news” about the state of the labor market with a preliminary estimate of revisions to nonfarm payroll employment growth from March 2024 through March 2025. The revisions are likely to be large and negative.
A table of contents for this post:
What is a benchmark revision?
What to expect?
Industry implications
Why did the BLS overestimate?
“Old News”
What won’t change?
What might change?
A common misconception
1. What is a benchmark revision?
Every year, in the January jobs report (released in early February), the BLS applies an annual revision to historical Current Employment Statistics (CES, or “establishment survey”) data within the report. The most scrutinized revisions are those applied to nonfarm payroll employment, though other widely-reported CES data like hours and earnings are also revised.
An important chunk of that annual revision is application of an employment benchmark to CES data corresponding to March of the prior year.1 Because we think of a lot of CES data in terms of delta rather than in terms of level (e.g. employment growth), the benchmark revision alters not only data from March of the prior year, but also for the entire year before that. So for example, the January 2026 report will directly apply a benchmark revision to the level of March 2025 data, and THAT revision will cause revisions to monthly data from April 2024 (the month after the prior benchmark date) and March 2025.
The reason the BLS does this is because the CES’s sample of establishments can drift off course from representing the economy. Establishments are created (which can lead to undercounts of employment), destroyed (which can lead to overcounts of employment), and the benchmarking exercise is a useful way of correcting that drift.
The source data for the benchmark data is the BLS’s Quarterly Census of Employment and Wages (QCEW), which is based on a more thorough universe of data sourced from unemployment insurance data. QCEW data is released with a 5 month lag relative to the CES. For instance, on September 9th, the QCEW will release Q1 (January through March) 2025 data; we already have CES data for August. For the CES benchmark, it’s this Q1 late summer release that matters the most, because the year-over-year QCEW change as of March generates the CES benchmark revision estimate.
So on Tuesday September 9th at 10 AM ET, the BLS will publish a preliminary benchmark estimate telling us by how much they anticipate the March 2025 payroll employment level to change. They will also include some details of revisions at a major-industry level; these can be interesting, because revisions at the industry level can be quite large even as they offset at the aggregate level.
5 months after this preliminary benchmark estimate, there is a final benchmark estimate which is then incorporated into the CES data in early February as described above. The preliminary and final estimates can vary a little because QCEW data is itself susceptible to revisions. Importantly, even after the preliminary benchmark estimate, we’re going to be staring for quite a while at the unrevised pre-March-2024 CES data for quite a while even though we realize it is due for a (large) revision.
Finally, a disclaimer for those unfamiliar with the benchmark process: it says nothing about what happened after the benchmark date. So while we could make some informed guesses about future revisions to data from April 2025 onward, they’re speculative at best.
2. What to expect
As of today, we have 3 quarters out of the 4 that will be used for the benchmark estimate. The BLS has released QCEW data through December 2024. Historically, these “3/4 of the way there” QCEW data have been reasonable predictive of the eventual benchmark revision - if the CES is overcounting 3/4 of the way through, we should expect a negative benchmark revision.
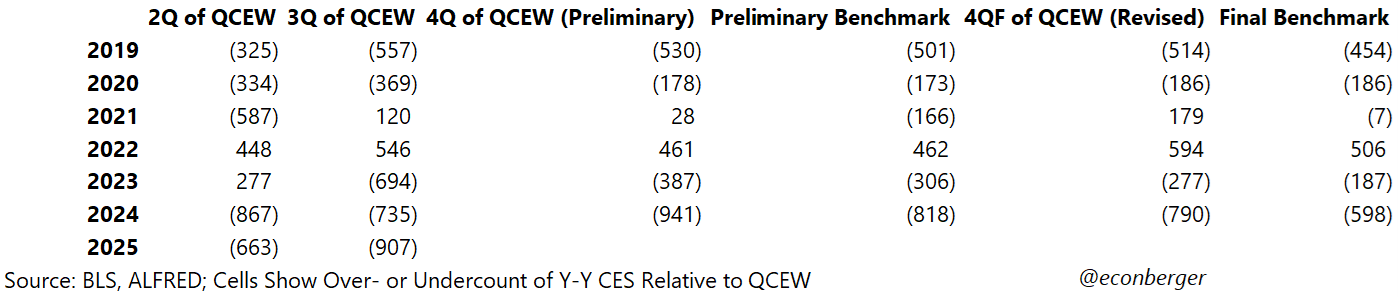
Well, currently the CES overcount is very large: 907,000. If taken literally and stretched out over 12 months, it suggests we should shave off about 75,000 per month from post-March-2024 employment growth - that’s about half of what’s currently estimated!
The number above is probably too pessimistic. Generally, benchmark revisions have been somewhat more optimistic than these 3/4-of-the-way-through estimates, by about 120K on average (10K/month). So my baseline (with wide error bands) for the eventual benchmark is around -787,000, or 65,000 per month. That’s still pretty hefty!
Currently, the CES estimate for nonfarm payroll employment growth from March 2024 through March 2025 is 1.758M (146K/month). If my estimate based on 3 quarters is right, we’ll end up with 0.969M instead (81K/month).
3. Industry implications
A related question of interest is “which industries will be affected by the revision”? I took a crack at estimating this by comparing, through December 2024, the gap between year-over-year growth in NFP-by-industry and QCEW-by-industry. It’s the same method I used for the aggregate employment benchmark revision estimate, but on an industry basis. One caveat is that my aggregate employment revision estimate incorporated historical average misses to come up with the 65K/month number, something I did not do with the industry estimates. So these numbers are probably collectively too negative.
You can see the results below. The gist is that downward revisions will be broad-based, but pain will not be eventually distributed. If you take my estimates very literally, in absolute terms we should see the largest revisions in transportation & warehousing (-129K), accommodation & food services (-105K), wholesale trade (-99K), retail trade (-91K), construction (-65K), administrative & other business services (-62K), and durable goods manufacturing (-61K).
In percentage terms, the ranking is slightly different: transportation & warehousing (-1.8%), wholesale trade (-1.6%), information services (-1.1%), other services (-0.9%), construction (-0.8%), and durable goods manufacturing (-0.8%).
The only positive revision of non-trivial size that showed up in this approach was in management of companies & enterprises (+42K; +1.6%). I wonder if this reflects a consolidation of business activity from satellite establishments into corporate headquarters.
To reiterate, this is a rough directional guide to where we might see the biggest revisions. I’ve never really tested this approach before at the industry level so caveat emptor! I’m looking forward to comparing these numbers to the final results.
4. Why did the BLS overestimate?
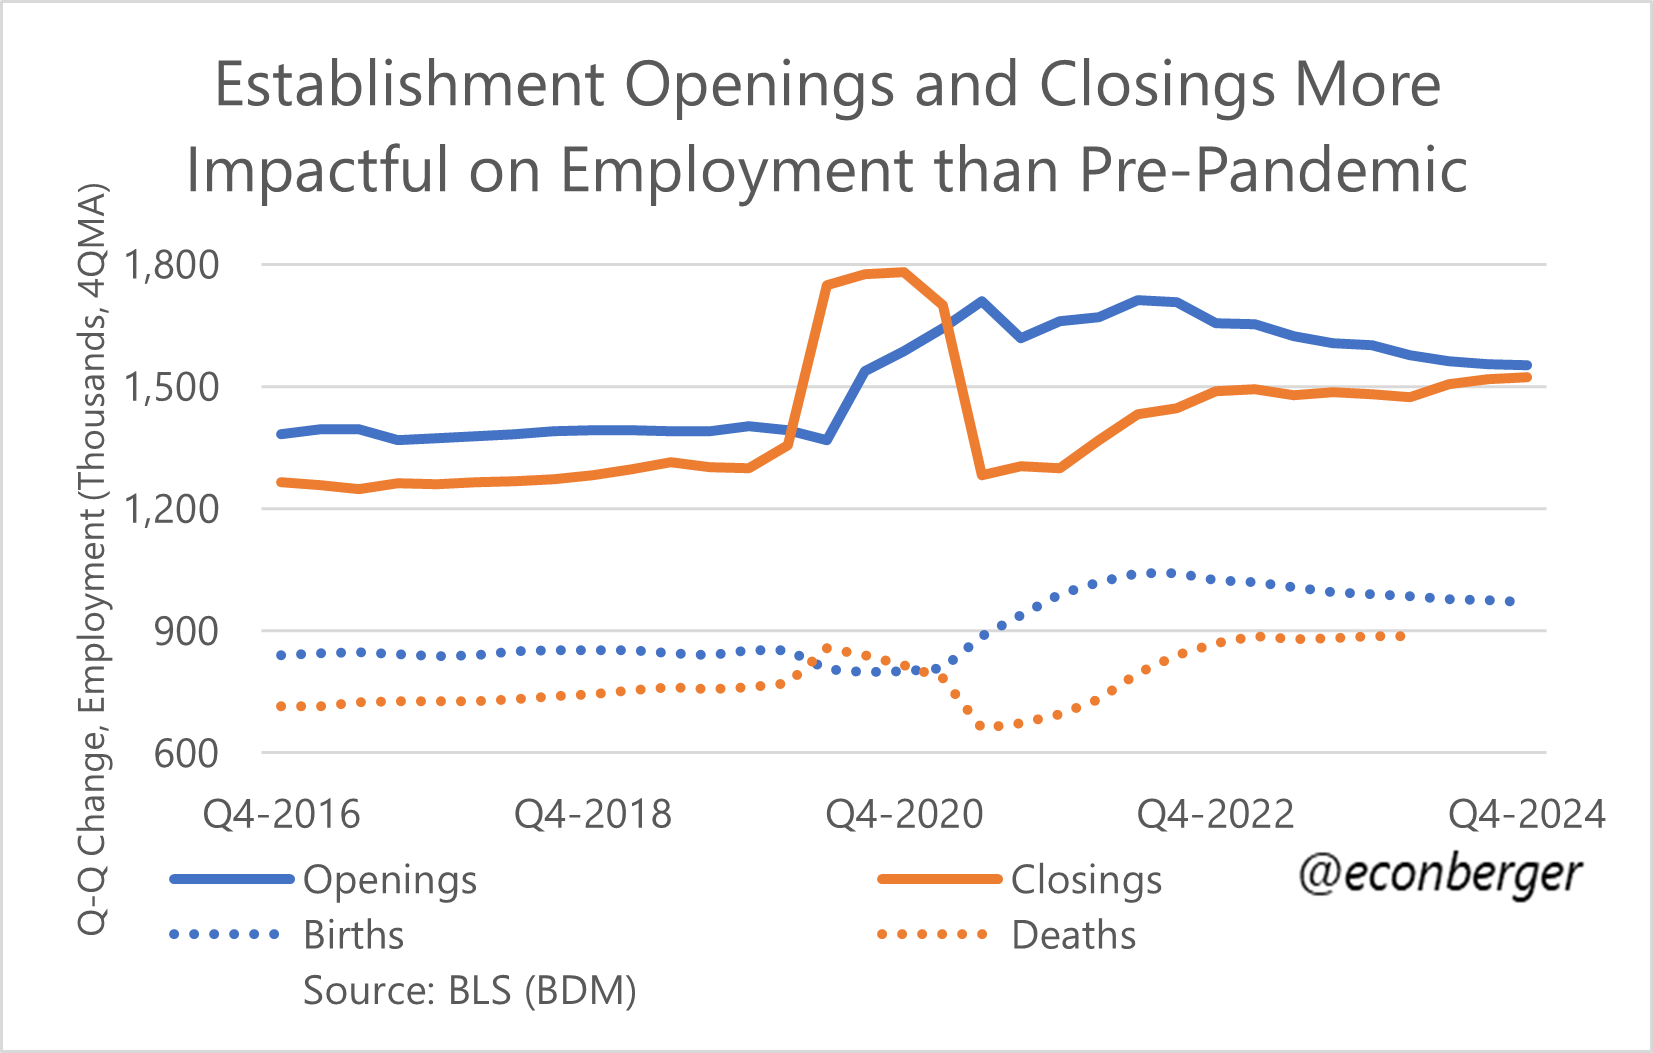
I dug into the Business Employment Dynamics data set (which is based on the same QCEW source data as the annual nonfarm payroll employment revision) and have a hypothesis. As mentioned earlier, the net birth/death model (NBDM) is the primary source of drift in the nonfarm payroll employment count. Data on actual job creation and losses at born/dead establishments is laggy and the BLS uses the NBDM to fill in the gap until the data is available. Those assumptions are non-trivial and when they’re wrong, big revisions (up or down) are inevitable.
What has the model gotten wrong? Well, one possibility is missing the ongoing downward drift in employment growth due to establishment births. Perhaps the BLS expected this to stabilize or even rise, but it’s moving in an adverse direction.
Another and possibly more significant surprise has been a recent increase in job losses due to establishment closures. These were stable over the past few years - the deterioration in actual net birth/death was coming from weaker births. But we did see establishment closures rise during in 2024.
I said “closures”, which is not the same as “deaths”. Death data lags (in terms of publication) relative to births, openings and closures. But it’s reasonable to speculate that a lot of those closures will prove to be deaths. And there’s a pretty good chance that (speculative) increase in job losses due to establishment deaths was not anticipated by the BLS model.
5. “Old News”
Let’s say we get a large implied downward revision to March 2025 nonfarm payroll employment level (which, again, won’t get actually applied to the historical time series until early 2026). I’m a labor market fanatic, not a financial market or Fed guy (much less a “vibes expert”), so for all I know the data we get on the 21st will significantly reorient those entities’ views. I’m mainly interested in the following question: how does our “all in” view of the labor market trajectory change?
My baseline answer: Unless you’re someone who’s been gripping onto very rose tinted goggles, not much. This is stale data from 5-17 months ago. We have much more recent, non-revisable data from the monthly jobs report (ratios from the household survey) that tells us the labor market has cooled a little over the past year (though perhaps with a very recent turn for the worse). If you’re looking to update that perspective, the marginal information from this preliminary benchmark is very low.
However… one thing that would give me pause is if 4 quarter CES-QCEW gap widens substantially from the 3-quarter 907K. That would hint (but not confirm) that there’s been additional relatively-recent deterioration in the labor market. The additional information about our current trajectory wouldn’t be very high, but not “very low”.
6. What won’t change
The QCEW and preliminary benchmark leave the Current Population Survey (CPS or household survey), which accounts for much of the key data in the jobs report, untouched. So there will be zero implications for the unemployment rate, the share of the labor force working part-time for economic reasons, labor force participation or the prime-working-age employment-population ratio. That means the stories household survey data tell us about recent trends in the labor market are going to be equally true on September 8th and September 10th.
Another important source of labor market data that will be unaffected: the unemployment insurance data. I know the initial and continuing claims data have been a little messy but they’re still indispensable.
7. What might change
Most of the attention from the preliminary benchmark announcement centers around employment (headcount) gains. But there are also implications for other parts of the CES - hours and earnings in particular. For instance, if low paying industries bear the brunt of the downward revisions, that would boost wage growth; if high paying industries bear the brunt of the downward revisions, that would lower wage growth.
Also, we usually don’t talk about it in the context of benchmark revisions, but eventually they’re applied to the JOLTS data. So for example, I’d expect that lower net employment growth will translate into some combination of lower hires, higher quits, and/or higher layoffs.
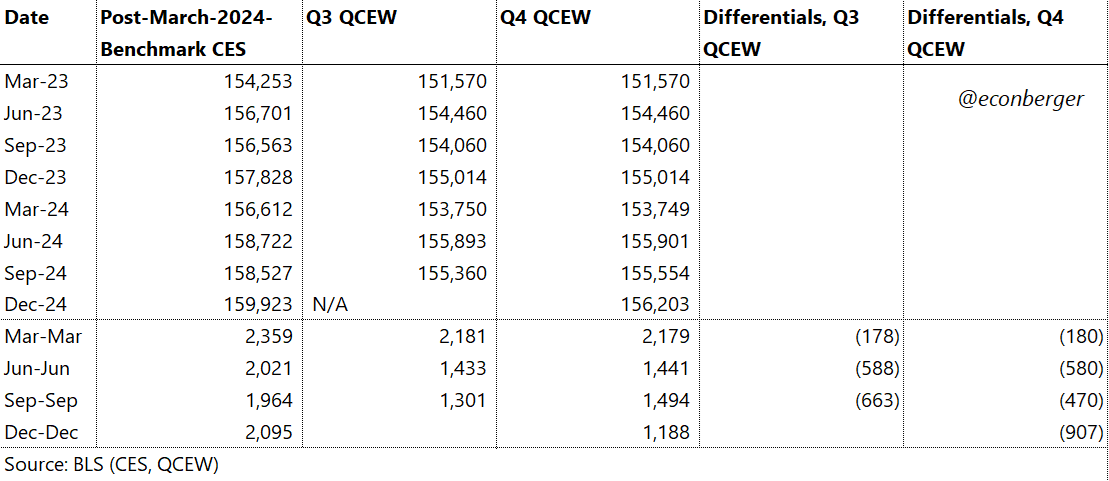
8. A common misconception
I’ll wrap up this piece with a pet peeves regarding usage of the QCEW data. From the perspective of CES revisions, the intra-year numbers don’t matter. The only thing that matters is the March to March change. So for example - the Q2 and Q4 2024 QCEW data looked particularly weak, whereas Q3 looked OK. That weakness won’t show up in the CES benchmark revision as particular weakness in Q2 and Q4 nonfarm payroll growth.
It can be debated whether the excess high-frequently volatility of the QCEW relative to the CES is a feature or a bug. Maybe the quarterly noise in the QCEW is telling us something important about labor market wiggles that the CES ignores. But you cannot infer anything about post-revision CES intra-year wiggles from the QCEW.
The annual revision also includes two other important elements - a revision to seasonal adjustment factors going back several years (which alters the intra-year wiggles but not the overall trajectory), and a revision to more recent data (post-benchmark date) based on the updated net birth-death model.
Guy, is there some inherent discrepancy in the benchmarking process as gig workers, contract employees, etc, are not captured the same way by the QCEW as they are by the monthly CES?