
On Alternate Indicators
How to Think About ADP, Revelio and the Chicago Fed Nowcast

TL;DR: With the probable government shutdown potentially disrupting short-run statistics publication and risk of government tampering looming in the background, I review two novel sources of labor market tracking from the Chicago Fed and Revelio as well as a grizzled veteran (ADP).
This post covers:
The Big Picture
ADP
The Chicago Fed Labor Market Indicators
Revelio
More below chart.
1. The Big Picture
BLS data, our best source for knowledge about the labor market, is at risk. In the short run the risk is a temporary federal shutdown of the federal government, which will at the very least delay the publication of key economic statistics and possibly disrupt their collection. In the medium run, the firing of BLS Commissioner Erika McEntarfer raises the specter of government tampering with these statistics, thereby making them unreliable.1
That’s raised interest in alternate trackers of labor market strength. Three worth highlighting are those from ADP, Revelio, and the Chicago Fed. They’re all somewhat different and hopefully this post can shed some light on them for practical users.
Before going any further, I want to quickly debunk a frequently stated claim that these can replace the BLS statistics. They can’t, because they’re all based on BLS data in some way. If the BLS data collection apparatus suddenly vanished, they would each face serious methodological problems. That doesn’t mean that what they’re doing is not valuable - I’m very glad they’re doing it. But we should be realistic about what they can and cannot achieve.
I also want to give a brief disclaimer: I’m going to talk about the strengths and weaknesses of each of these at least a little (because no data is perfect) and I hope that is taken by readers in the right spirit. We are all lucky that, in the (hopefully brief) absence of BLS, they’re stepping to partly fill the breach.
1. ADP
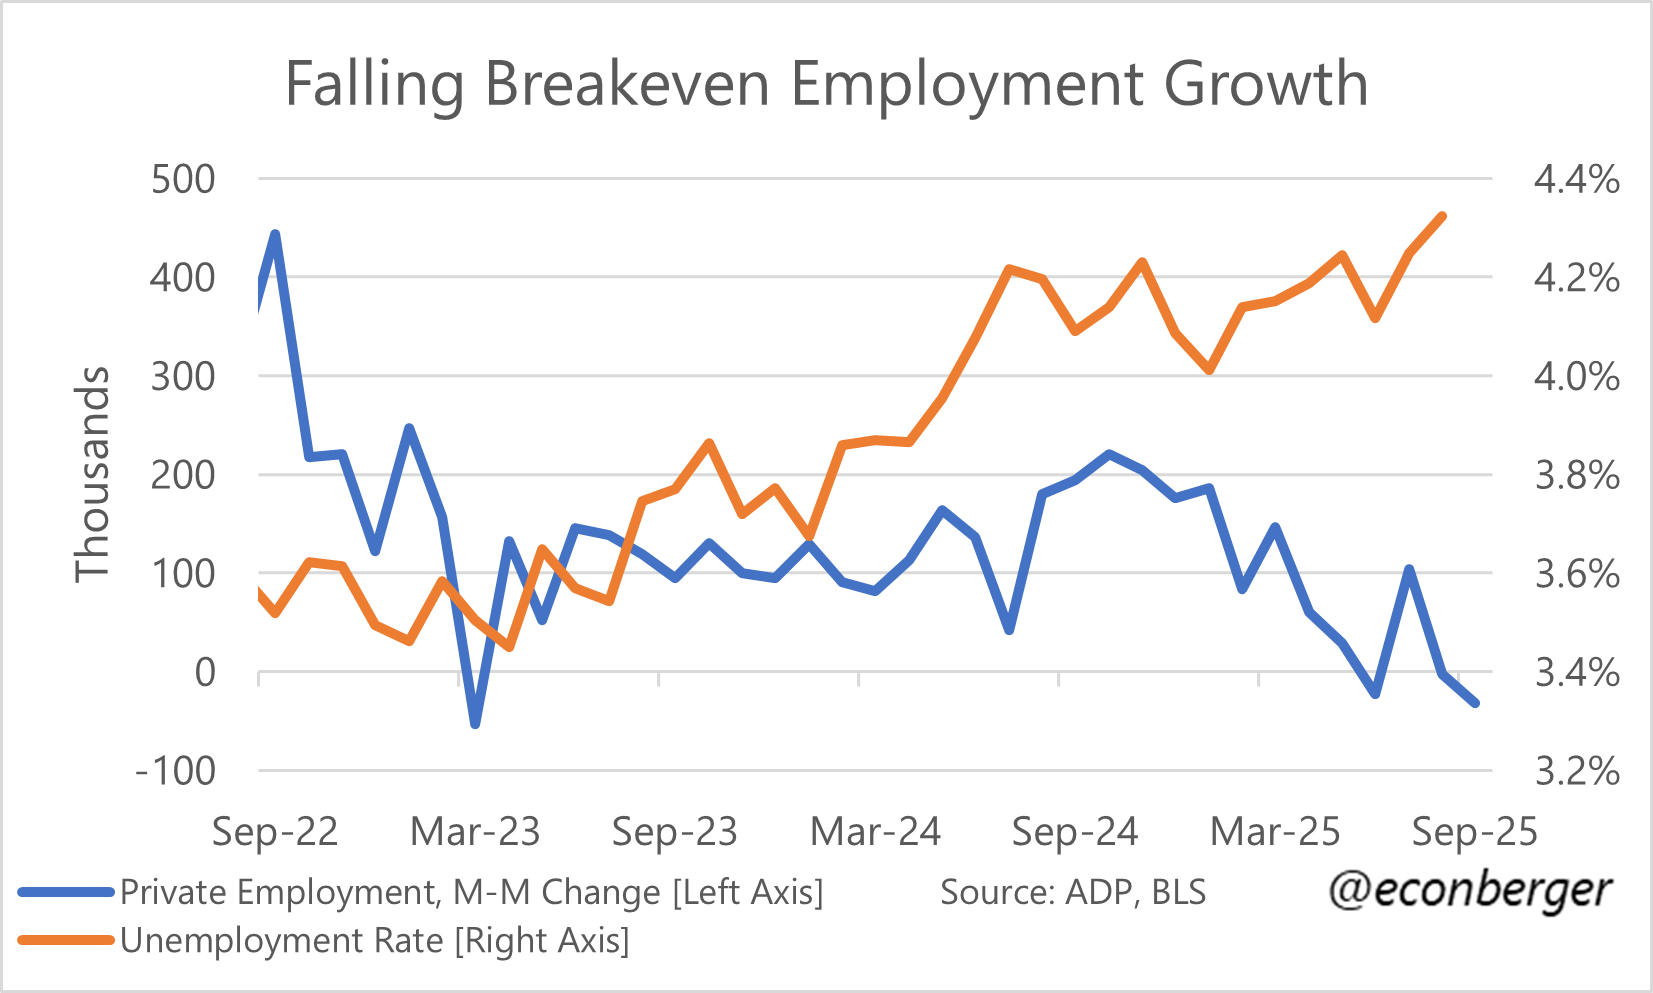
ADP, the veteran of the group, gets attention for its estimate of monthly private sector employment growth, based on the company’s own proprietary data. It’s undergone several methodological revamps; the most recent came in 2021, in partnership with the Stanford Digital Economy Lab.
I won’t spend as much time on ADP as on the other two providers since it’s relatively well-known but want to emphasize two things. The first is that ADP uses the BLS’s Quarterly Census of Employment and Wages (QCEW) to develop representative weights for its source data. In other words, the QCEW allows ADP to reweight its own proprietary data to match the US labor market more closely. This is a good thing and I’m glad ADP does it. But they’d run into trouble if the QCEW collection/publication was disrupted.2
The second caveat is that employment growth, while very interesting, is vulnerable to the labor supply growth problem that’s bedeviled our understanding of the job market over the past 2-3 years. For instance, during 2023 and the first half of 2024, employment growth painted an overly flattering picture of labor market strength. And more recently, the sharp crackdown on immigration means relatively weak employment growth is sufficient to keep the labor market steady.
When thinking about the constellation of BLS data, we use indicators like the unemployment rate and prime-working-age employment-population ratio to overcome this problem. I would love it if ADP came up with a comparable solution, but as of now none exists (to my knowledge).
2. The Chicago Fed Labor Market Indicators
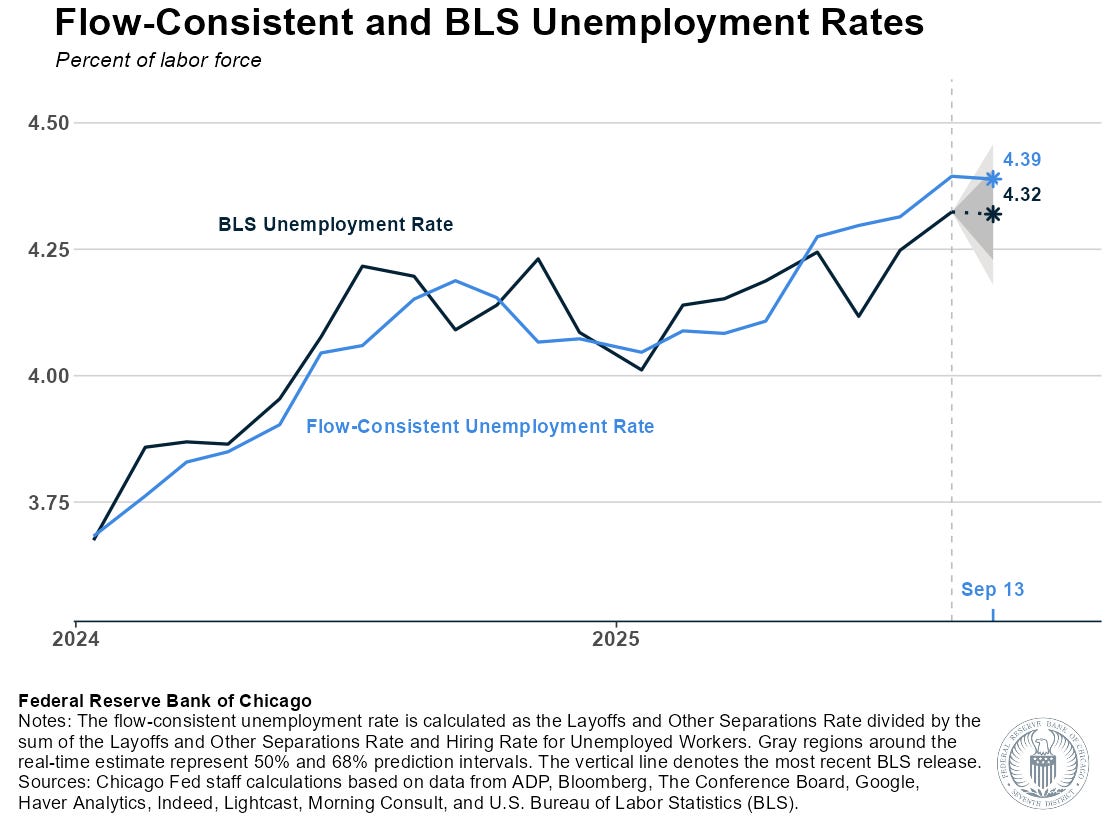
This set of indicators was announced last week and I was pretty excited, mostly because of the unemployment rate nowcast. It’s what I will be paying attention to most closely until the BLS data comes out.
The Chicago Fed work is conceptually distinct from ADP’s. ADP and BLS private-sector nonfarm payroll employment attempt to measure the same thing using distinct data sources (ADP’s proprietary data vs. the BLS’s establishment survey). So while ADP functions as a nowcast of BLS data, it also stands on its own.
The Chicago Fed uses a variety of sources, both private-sector and public-sector (including ADP!) to nowcast the BLS’s unemployment rate. Unlike ADP, it doesn’t have an “independent existence”. (Sorry if this feels like a philosophy seminar…)
The two key elements of this nowcast are flows in and out of unemployment. It’s worth emphasizing a few subtleties in these measures. The first is these aren’t based on the labor market flows data published by the BLS as part of the monthly jobs report. Instead, they are compound metrics based on two “primitives”: the level of unemployment, and the level of very short term unemployment (less than 5 weeks).3
The second is that, though they are characterized as a “job finding rate” and a “separation rate”, these really are flows out and in of unemployment. For example, a big chunk of the "job finding rate” is actually flows from unemployment out of the labor force (rather than into employment); a big chunk of the “separation rate” is actually flows from out of the labor force (rather than employment) into unemployment.
I wouldn’t get caught up in terminology though - the idea is to build a nowcast of the unemployment rate. In the absence of the monthly jobs report, having this as a proxy for the unemployment will be very useful. And I hope the Chicago Fed team expands this to look at other indicators, like the prime working age employment population ratio.
Another subtlety is that hires from unemployment are a subset of overall hiring - they omit hires of the already employed, and hires of those not in the labor force. A third is that the Chicago Fed’s estimated flows are not the same ones as those published directly by the BLS.4
Because some of the inputs to this model will not be published during the shutdown, my guess is its accuracy will be negatively impacted. (And of course, the longer the shutdown lasts, the more it could drift off course.) But I’m extremely glad to have it.
3. Revelio
The Revelio data set calculates a bunch of indicators. The data I’m most interested use LinkedIn profiles as its source.5 Revelio calculates separations (which it calls “attrition”) and hiring, then uses both to calculate a net employment growth measure.
As with ADP, Revelio has an underlying dependence on the BLS - they reweight their underlying dataset using the annual Occupational Employment & Wage Statistics data. This is important because LinkedIn membership has a well-known bias toward white-collar roles (though this bias has diminished over time). If the BLS stopped publishing that data, Revelio would need to find another (currently non-existent) source of relatively timely ground truth.
Another well-known issue with LinkedIn data is “delayed profile updating”. A person may start or end a job in August 2025 but not report it on their profile until November 2026, so if you don’t correct for it you’ll have large, predictable undercounts of hires and separations in recent data. Revelio makes a valiant effort to correct for these, much like we did when I was at LinkedIn.
I feel good about Revelio’s correction for the hiring undercount; I am a little more concerned about their correction for the separations undercount, because such a correction is really hard! Quits reporting on LinkedIn is likely to be more timely than layoff reporting; and if the underlying frequency of layoffs and quits are changing, that means that you’ll (probably) undercount separations when layoffs are high and overcount separations when layoffs are low. So I suspect the net employment headcount will be too optimistic if we tip into a downturn. (Am open to being wrong on this!)
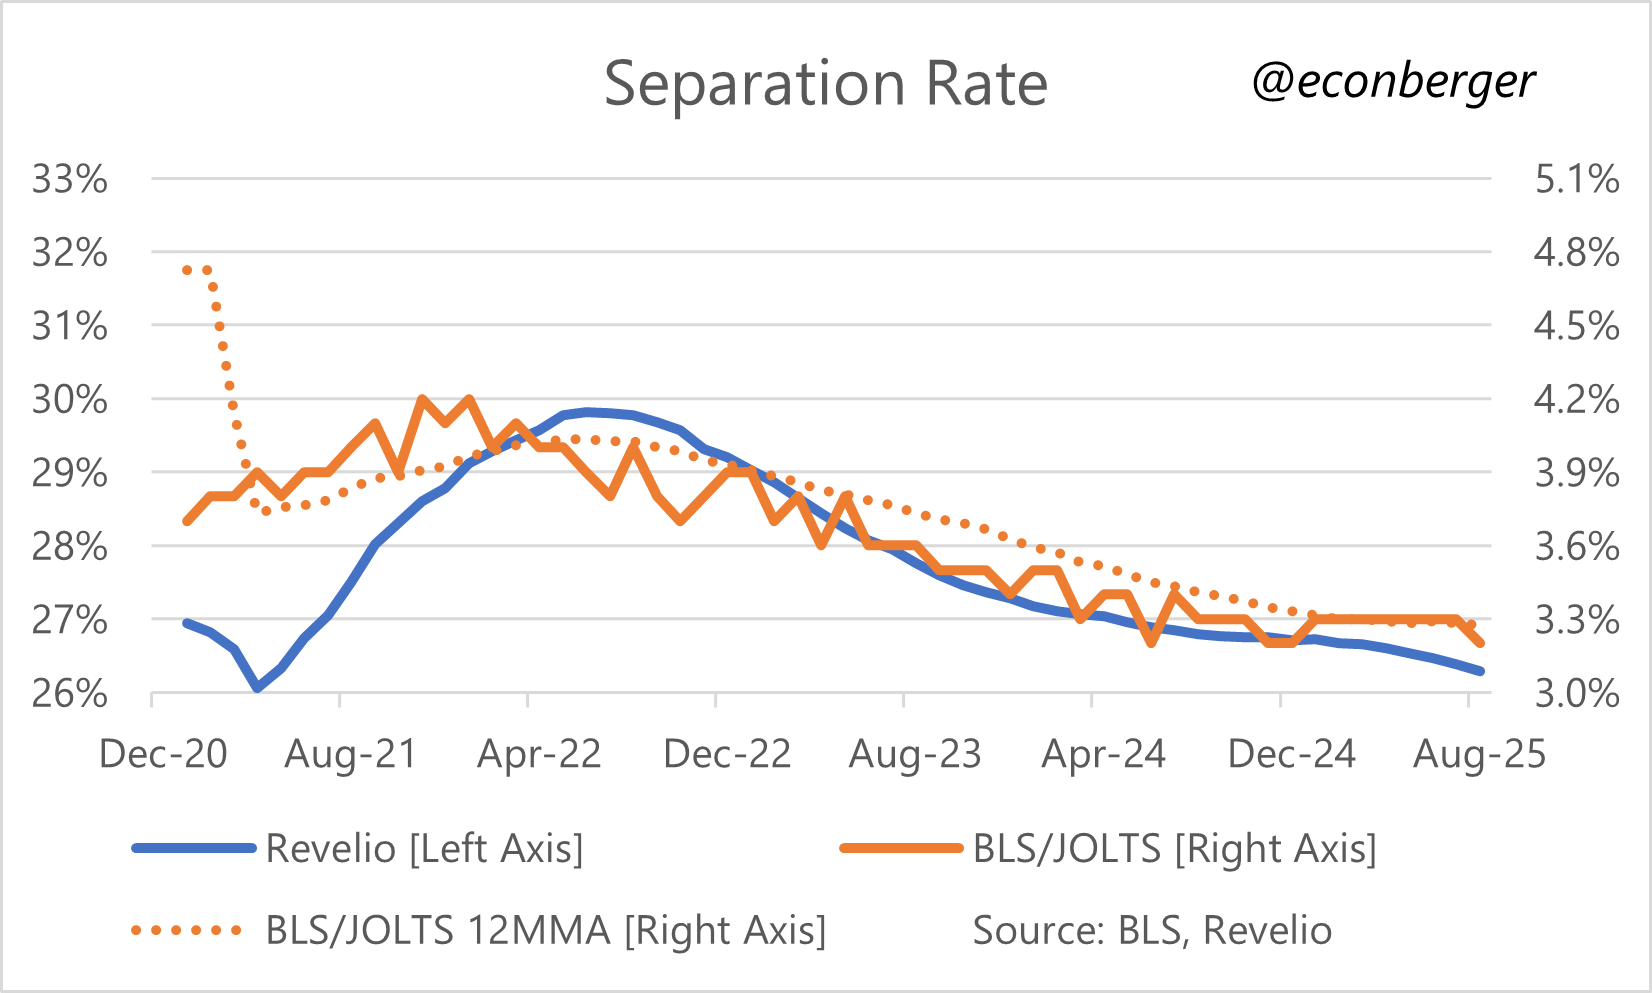
Another mild gripe I have with the Revelio data: they use 12 month smoothing on hiring and separations. This is implemented for noise reduction purposes, but as you can see from this chart also significantly reduces the signal - the peaks in hiring and separations is observed quite late:
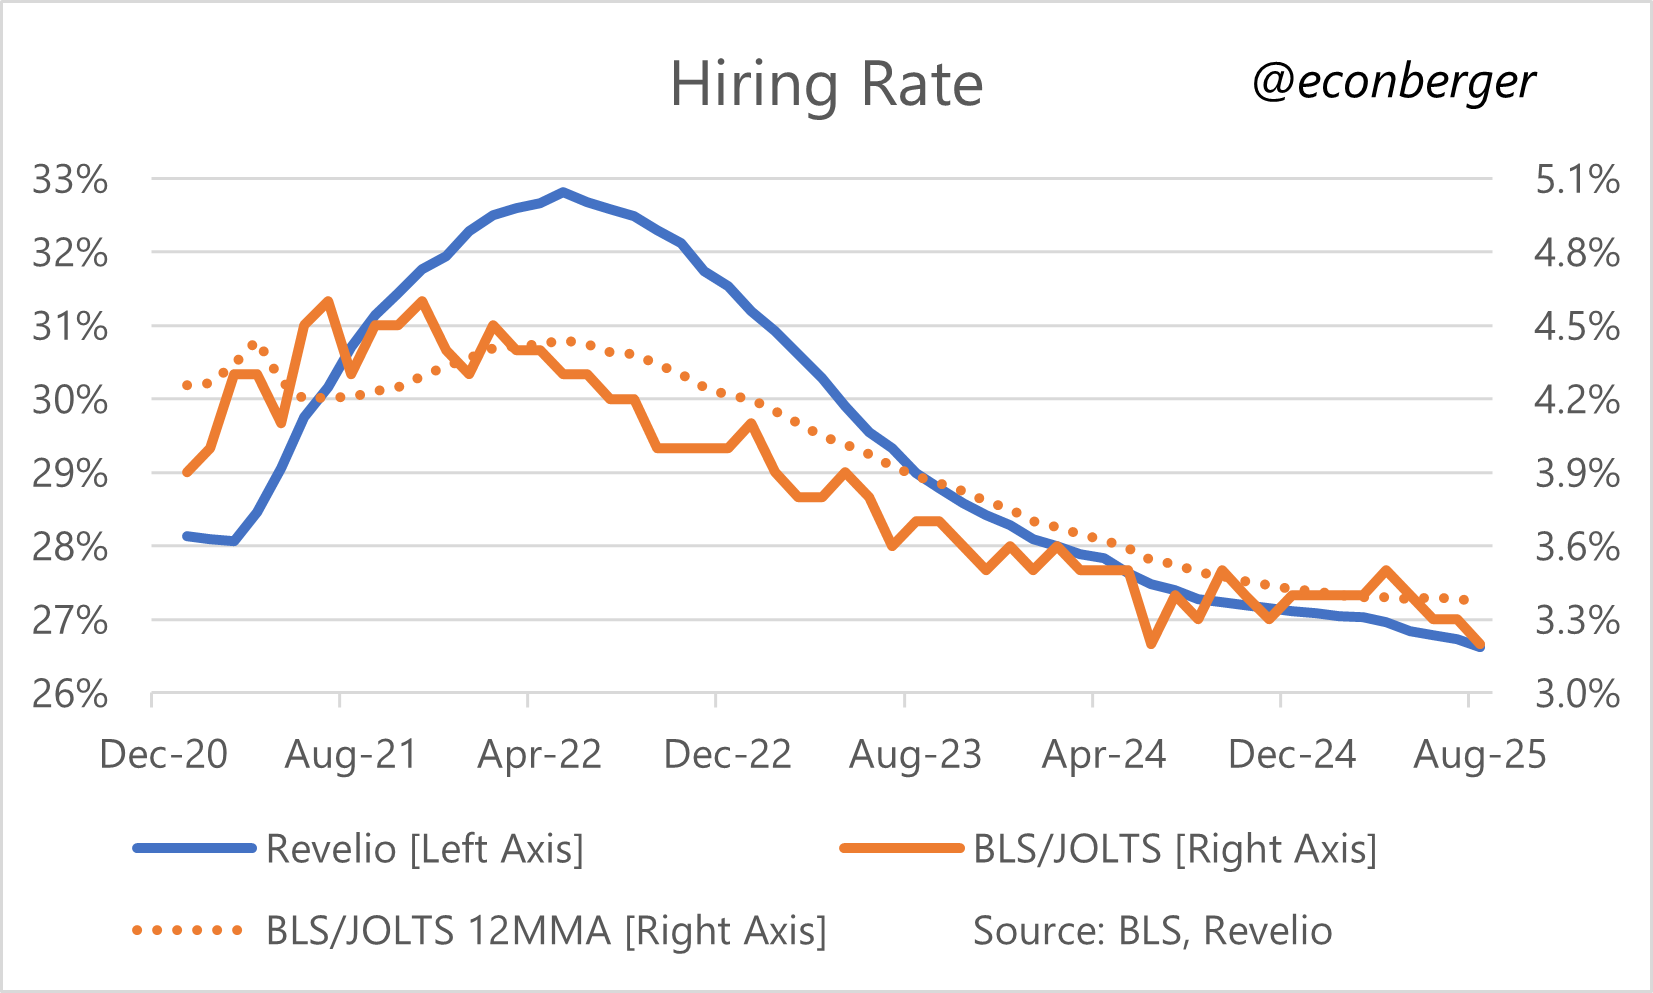
At any rate, while net employment growth will get most of the attention, I think Revelio’s hiring rate estimate, smoothed as it is, is the most valuable part of the report. Like the JOLTS hiring rate (and unlike net employment growth), it’s relatively insulated from the labor supply issue.
I find the separations rate to be less valuable because, data reporting lag issues aside, it blurs the powerful signal of its two core components: hiring and layoffs. I would love for Revelio to explore ways of calculating them separately.
So far there’s no reason to believe that tampering has happened. But going forward it’s a very real and unsettling risk.
In all likelihood, they could use stale weights for a while. But at some point representation worries would emerge if there was no replacement.)
I’ve done some preliminary comparisons to the flow data and it seems reasonably close.
The BLS flow data look at directly measured transitions, whereas the Chicago Fed approach looks at changes in aggregates. So the BLS flow data undercounts some transitions (from people who enter or exit the sample); the Chicago Fed approach imputes flows rather than measuring them directly.
Revelio also calculates data on openings - my guess is the most relevant point of comparison here is Indeed. I’ll let others discuss the differences there.
If we're going to have government shutdowns on a regular basis, then maybe the BLS should be moved under the Federal Reserve, or at least funded by the Fed.