


Future Revisions to Employment Growth
Nonfarm Payroll Employment Gains Over the Past Year Are Probably Overstated

TL;DR: Q3 Business Employment Dynamics data is a reminder that post-March-2024 nonfarm payroll gains are probably overstated, but shouldn’t change your perspective on labor market health (“it’s doing OK through April 2025”) much if you’re approaching the data holistically.
This post is split into the following sections:
What are “Business Employment Dynamics”?
Why are we talking about it today, and what we knew before this release?
Be careful about extrapolation
Follow the household survey ratios; we’re not in recession
A recurring warning about lower labor supply growth
More below chart.

1. What are “Business Employment Dynamics”?
Every quarter, the Bureau of Labor Statistics publishes two data sets. One, the Quarterly Census of Employment & Wages (QCEW), tracks employment and wages using unemployment insurance coverage data - which corresponds to over 95% of US workers. The most well-known (but far from only) use case for the QCEW is generating an annual “benchmark” for the Current Employment Statistics (CES).
The CES, also known as the “establishment survey”, is the source of data in the monthly jobs report like nonfarm payroll employment, average weekly hours, and average hourly earnings. It’s one of our most timely sources of “hard data” about the labor market, but runs into a problem: the establishment sample from which it draws data can drift out of whack with the actual economy, becoming overly optimistic or pessimistic. The QCEW’s benchmark enables the BLS to re-anchor that sample to reality once a year.
The Business Employment Dynamics (BDM) data, usually released about 1-2 months after the QCEW, uses the private sector QCEW data to create an incredible data set for disaggregating employment changes. For example, you can split employment gains by firm size; you can determine which employment gains/declines come from firms expanding/contracting, and which gains/declines come from firms opening or closing.
The BDM has one feature that the QCEW does not: its published data is seasonally adjusted. So while its primary purpose isn’t to generate measures of aggregated quarter-over-quarter net employment growth, you can easily use it this way.
2. Why Are We Talking About It Today, and What Did We Know Before This Release?
On Wednesday May 7th, the BLS published the Q3 2024 BDM data. The data showed two consecutive quarters of private sector employment decline (albeit, just barely negative in Q3 at -1K). That’s a strong contrast to what the CES showed: a gain of about 89K per month during Q2 and Q3 2024. This raised all sorts of worries among data watchers: are payroll gains during that period overstated? Are they still overstated? And most alarmingly, "have we been in recession this whole time?!?!?!” (I’ll talk about this more later, but spoiler alert: the answers to these 3 questions are “very likely yes”, “possibly”, and “no”.)

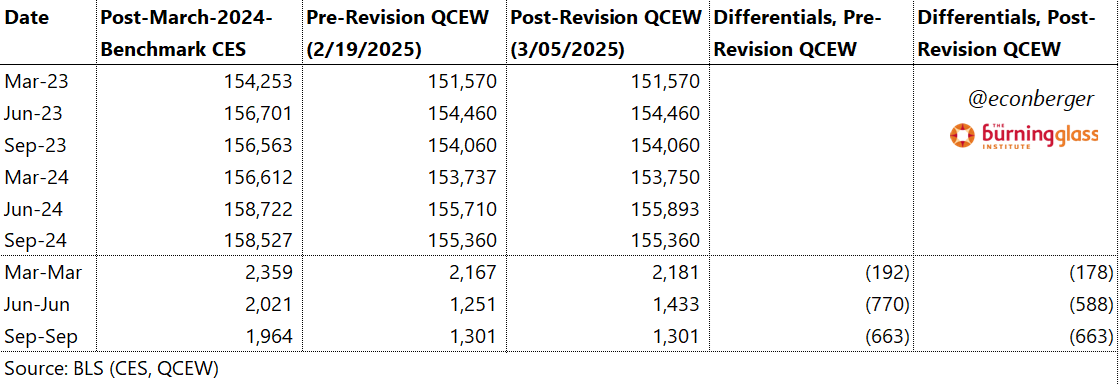
But as stated earlier, the BDM data is based on the QCEW, which was already indicating a substantial CES overcount of employment growth during Q2 and Q3 2024. I wrote about it back in February and March. The BDM release didn’t provide much additional information on this front.
3. Be Careful About Extrapolation
The most important thing to remember: the CES benchmark exercise occurs annually, using 4 quarters of QCEW data; we only have 2 of those 4 quarters in hand. We’ll get the Q4 2024 QCEW data in early June, and the Q1 2025 QCEW data in early September. At that point the BLS will provide a preliminary estimate of the March 2025 benchmark revision to nonfarm payroll employment. We’ll get additional revisions to benchmark-relevant QCEW data in early December 2025, and then the final benchmark revision to March 2025 nonfarm payroll employment in early February 2025.
The intra-benchmark QCEW/BDM data are mostly irrelevant to the eventual benchmark revision. They matter insofar as how they contribute to the overall full-year sum, or to the degree that partial QCEW data predicts the full year’s QCEW data (more on this below). But when it comes to the eventual post-revision nonfarm payroll delta, a -500K revision will look the same regardless of whether the underlying QCEW suggests a -125K revision each quarter or a -1400K revision in the first quarter and a +300K revision in each of the next 3.
Of course, you could make the case that we should be using the QCEW/BDM data instead of the CES as our labor market source of truth: it is more comprehensive. (Though… it is also susceptible to substantial revisions!) But it’s substantially more volatile than the CES data. Using the less-volatile CES, we can usually derive fairly decent near-term predictive power and strong signal about the current macroeconomic environment; the data probably won’t look too different in a few months relative to what it looks like today. This is what enables us to rely on non-farm payrolls as a fairly decent business cycle indicator, even when we believe it has a large overcount or undercount.
The BDM/QCEW path, on the other hand, is much more of a zig-zag. Weak quarters within the context of a labor market expansion are quite common. You’re giving up a lot of signal and useful inference about the macro context.
This volatility also has implications for the eventual benchmark revision. It’s a mistake to extrapolate the CES overcount over the past 2 quarters into an additional, comparable overcount over the next 2. It’s quite reasonable (but not certain) to believe that the eventual benchmark revision will be negative; it’s also not-insane (but riskier) to believe that the eventual benchmark revision will be negative AND large. But the predictive power 2 quarters in is quite weak.
Last year provides a useful cautionary tale. The Q3 2023 BDM release in May 2024 indicated that private employment had increased by 332K in Q2, and declined by 192K in Q3 (a net increase over 6 months of 140K). This was much worse than contemporaneous estimates by the CES, which estimated a private-sector employment increase of 1,164K over the same six month period.1 Eventually, we did see a downward revision in the CES estimate over these two quarters… to a still-substantial 840K. The reason: a combination of upward revisions to those initial Q2 and Q3 2023 BDM/QCEW data plus relatively strong Q4 2023 and Q1 2024 BDM/QCEW data.
4. We’re Not in Recession; Follow the Household Survey Ratios
We’re going to be waiting a long time (3.5 more months) for the full-year QCEW data. So “how can we know the truth”? Well, my usual advice in these contexts is just to look at key indicator ratios from the Current Population Statistics (CPS), or household survey. The CPS is untouched by QCEW data. While it is susceptible to changes in underlying population estimates, the ratios produced by it experience much smaller shifts. And this is what one of the ratios from the survey is telling us:

I think it’s interesting that we saw a particularly large move upward in the unemployment rate during the same period that the BDM was particularly weak (Q2 and Q3 2024). But the unemployment rate has been flat in the subsequent 7 months; that sequential spring/summer weakness didn’t persist.
You see something similar in the share of people working part-time for economic reason: a step up during the summer, then a much slower subsequent ascent.

And the prime working age employment population ratio is down modestly over the past year. The timing of the step down is a little later in this series than in the prior 2, but it doesn’t look recessionary either.

None of this means that we won’t weaken further if tariffs sap the strength of the economy. But the labor market is still doing OK in the hard data we have, from April and early May.
5. A Recurring Warning About Labor Supply Growth
This point is mostly tangential to the prior discussion, but the tendency to mentally link the amplitude of employment growth to labor market strength has been a false signal during the last few years. During late 2023 and early 2024, a surge in labor supply (induced by a surge in immigration) led employment growth to temporarily reaccelerate even as the labor market cooled.
Immigration was already slowing due to tighter enforcement in the second half of 2024, a trend that has probably intensified under the current administration. That means we’re likely to face the mirror image of late 2023 and early 2024: a “weakening” in employment growth that’s slack-neutral. That doesn’t mean that the labor market will tighten or unemployment growth - it just indicates that lower employment growth does not tell us much about labor market health on its own. You need to look at the household survey ratios.
It’s also bigger than the current CES-BDM gap of 800K.