TL;DR: Hurricanes and strikes make precise interpretation of the October jobs report difficult. Some of the numbers were very weak, but clearly depressed by special factors; we don’t know whether, in the absence of those special factors, the report would have looked good or mediocre.
Key Data Points:
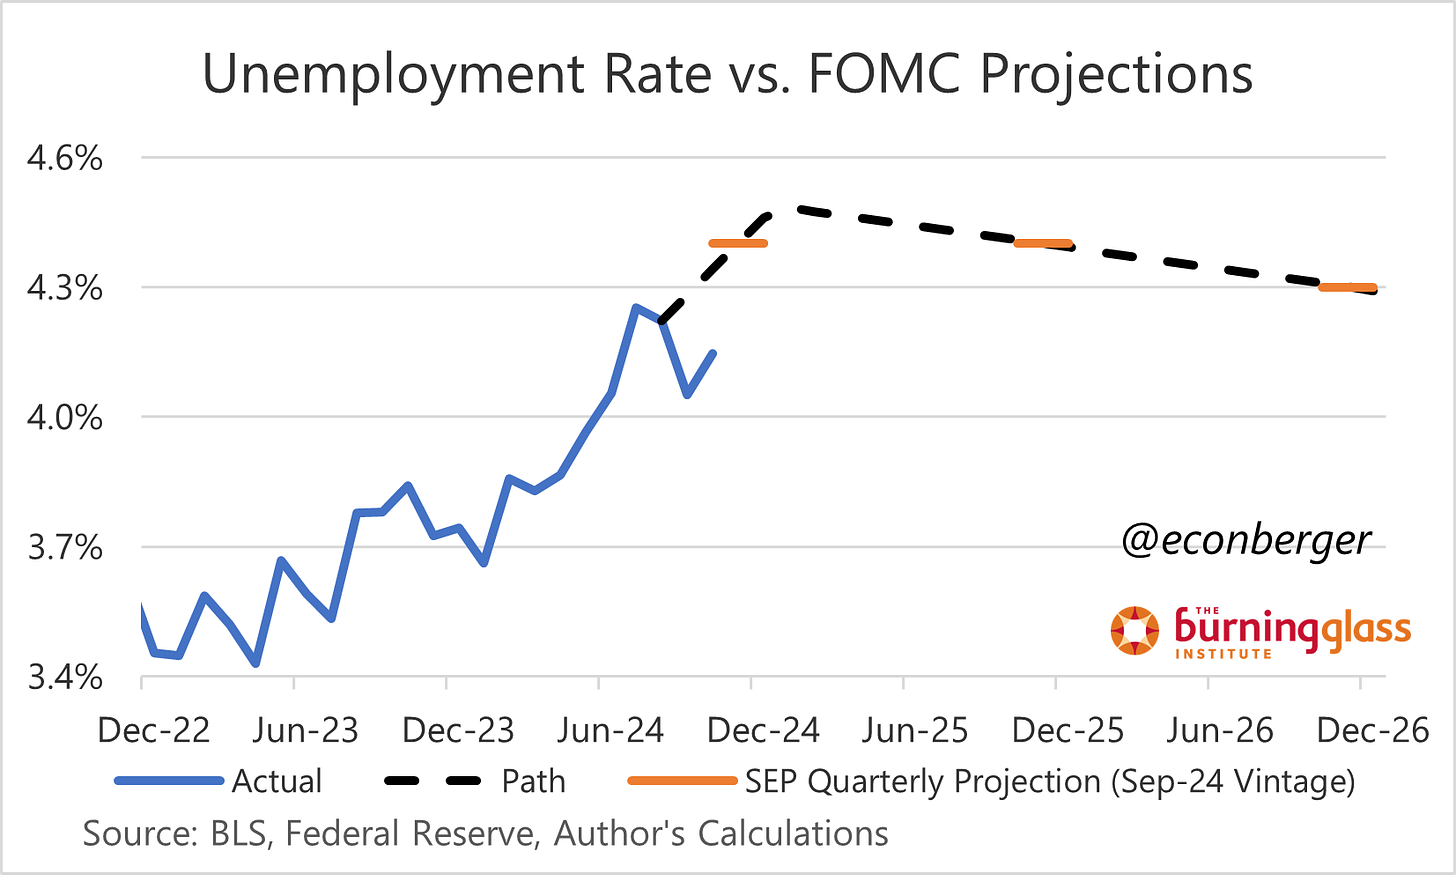
Unemployment rate: rose from 4.051% to 4.145% (not good; hurricane impact?)
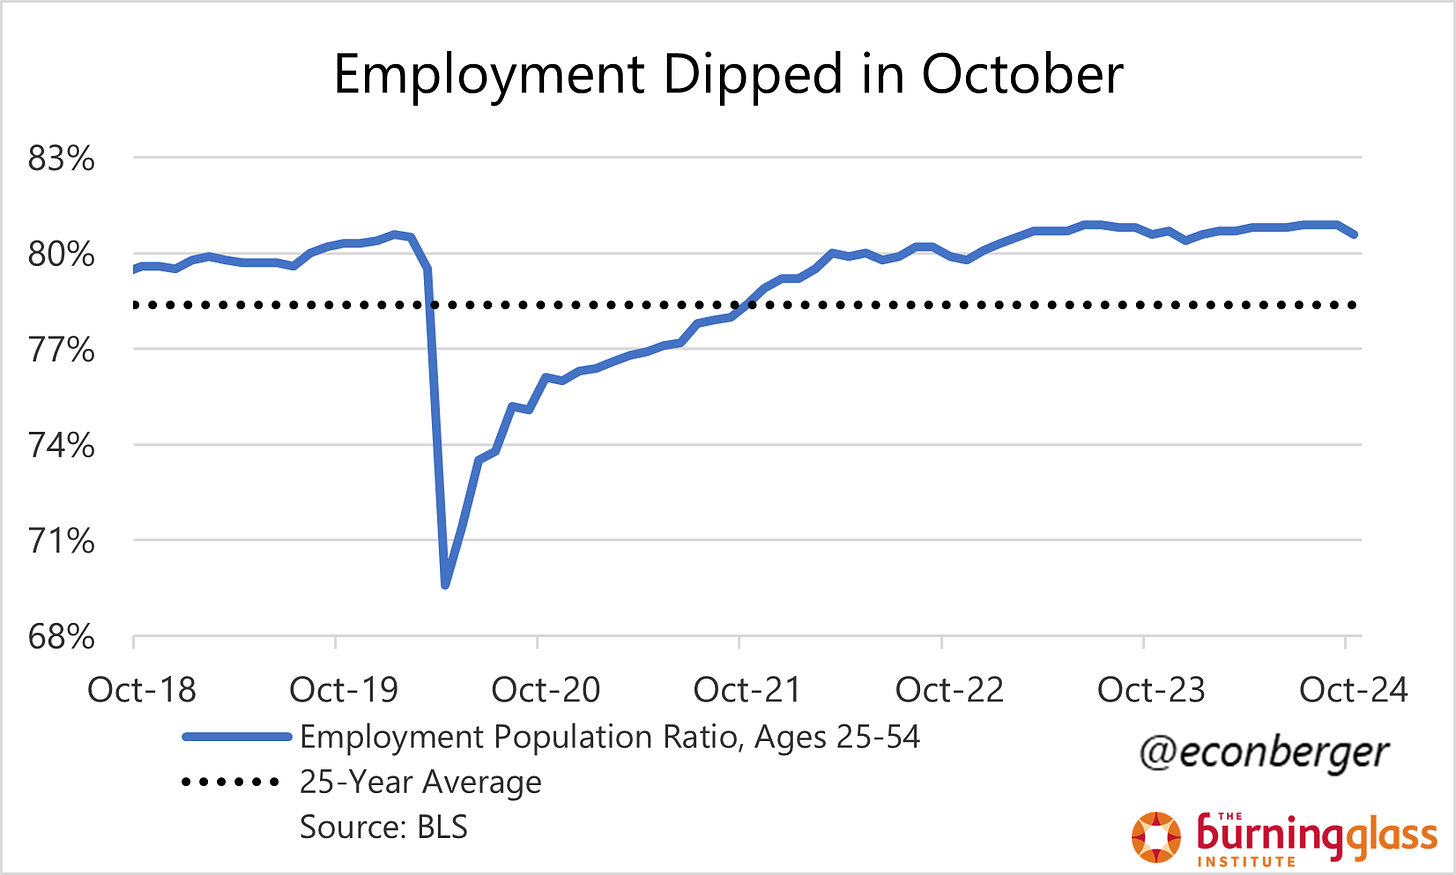
Prime working age employment population ratio: fell to at 80.6% (bad; hurricane impact?)
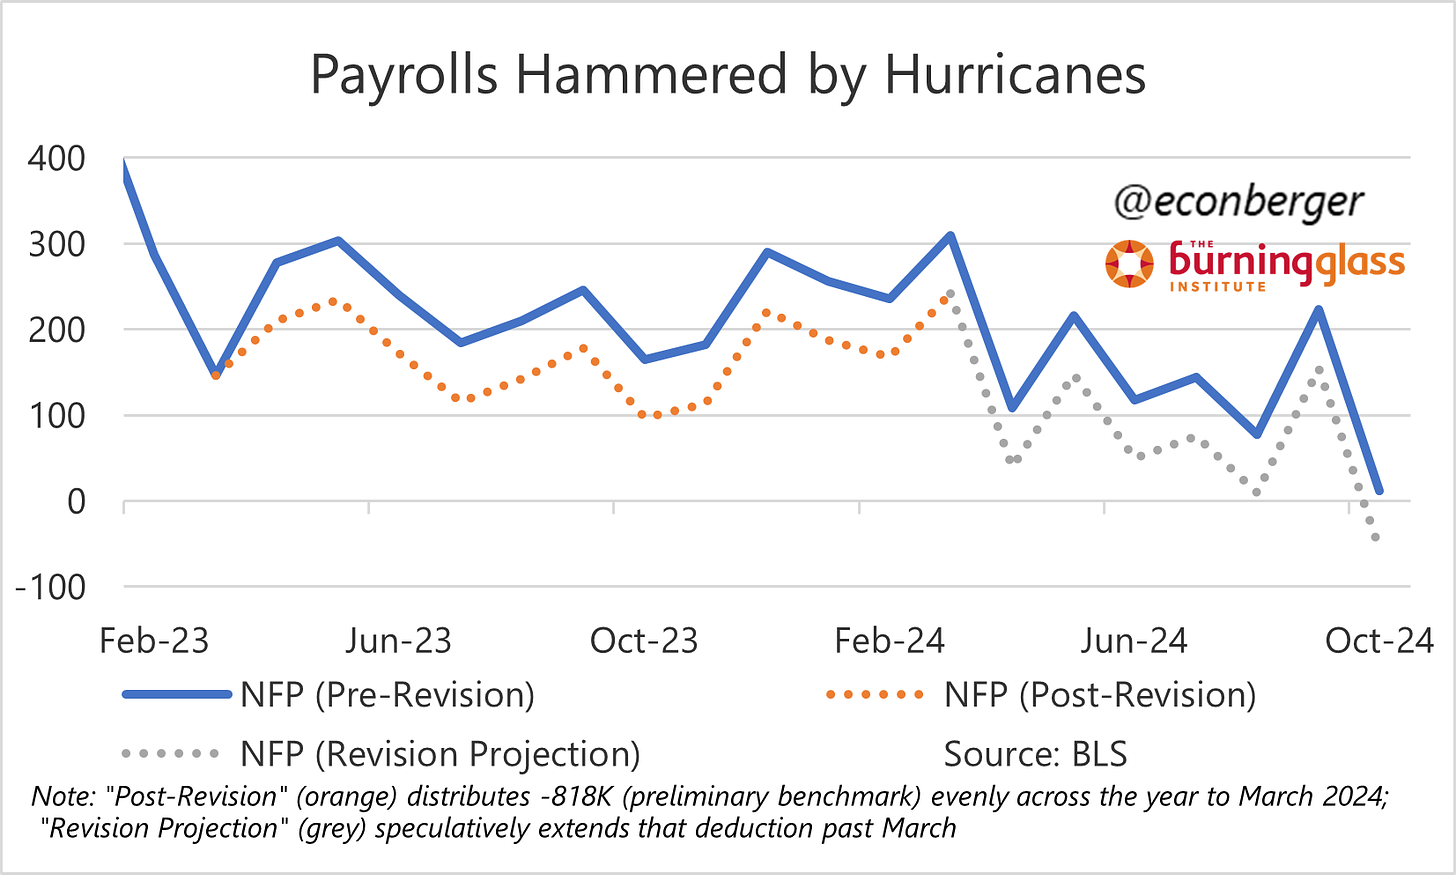
Nonfarm payroll employment: rose by 12K (weak, even after considering future revisions)
The rest of this post is structured as following:
The Big Picture
Special Factors
Hurricanes
Strikes
More below chart.
1. The Big Picture
We just don’t know.
Weather and strikes had a clear, large adverse impact on nonfarm employment (and the establishment survey more broadly) in mid-October, the period to which this report correspondents. They may have also adversely affected (on a much smaller scale) the major employment and unemployment aggregates in the household survey.
But we can’t say much more than that. We're used to attaching a lot of precise meaning to the monthly jobs numbers. I’m not sure that is a healthy exercise even in benign circumstances, but it’s a lost cause this month. Folks will try to calculate what the data would have looked like in the absence of hurricanes and labor disputes, some thoughtfully and others less thoughtfully, but I don’t think it’s a fruitful exercise. We’re just going to have to wait until next month’s data.
Today’s report is a good way to audit the integrity/wisdom of the folks you follow on this topic. There are folks out there erroneously playing this up as a very weak report without addressing the special factors. You should not trust them. Reasonable people can disagree on whether the data would have been mediocre or strong, though hopefully with humility that our crystal ball is cloudier than usual.
Speaking of “mediocre or strong”, we’re still waiting for evidence on whether September’s strong report was a blip or a genuine break in the labor market’s cooling trend. I landed on the side of “blip” (but am crossing my fingers that I’m wrong); today’s report doesn’t change my perspective.
Onward to the November report!
2. Special Factors
a. Hurricanes
The Southeast got hit by two major hurricanes between the September and October jobs reports. Helene had a devastating human toll on southern Appalachia in late September, and then Milton hit Florida in mid-October during the period when data was collected.
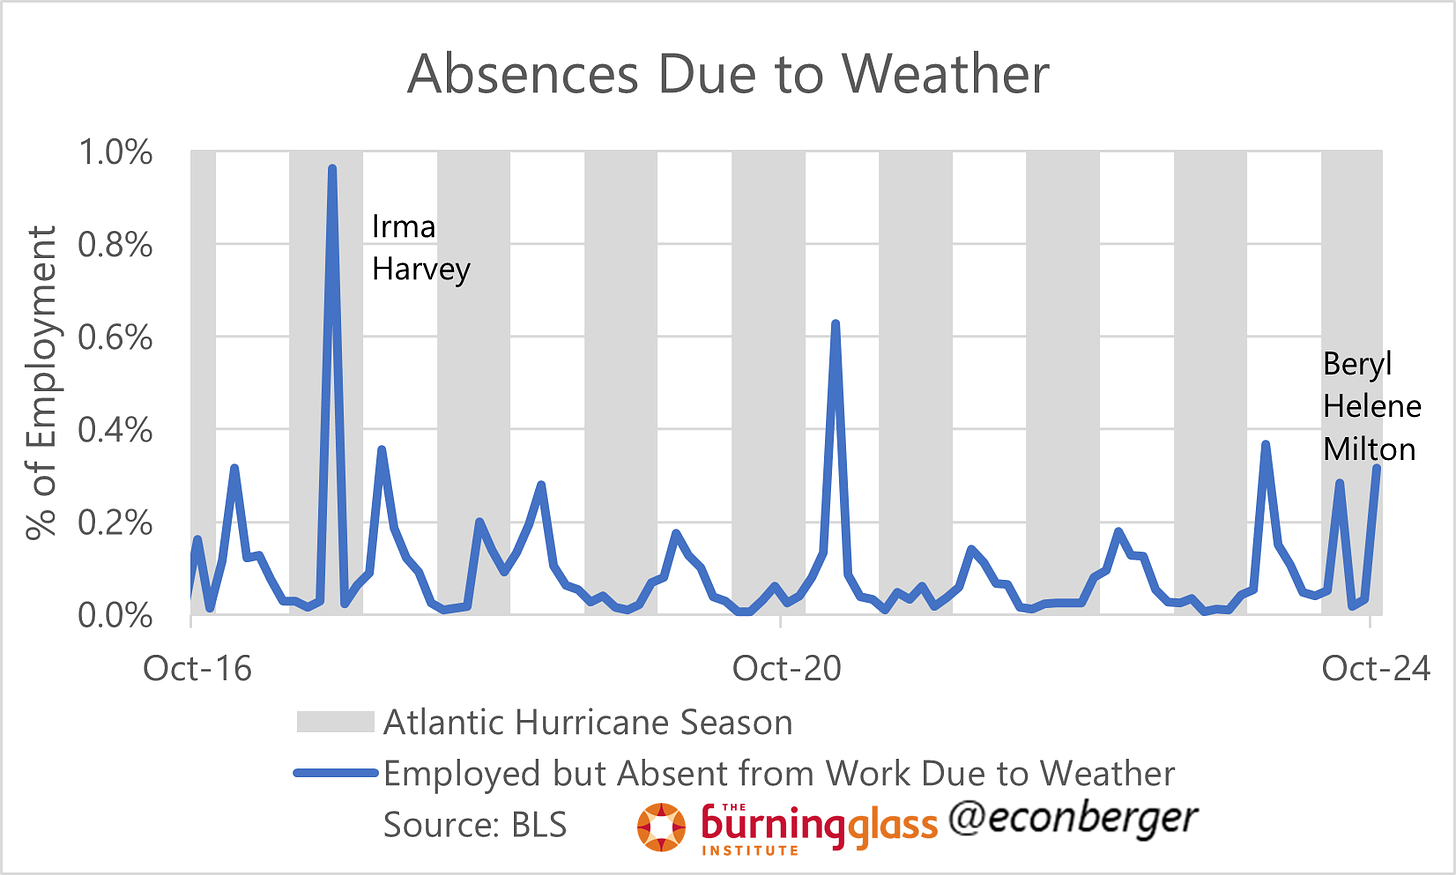
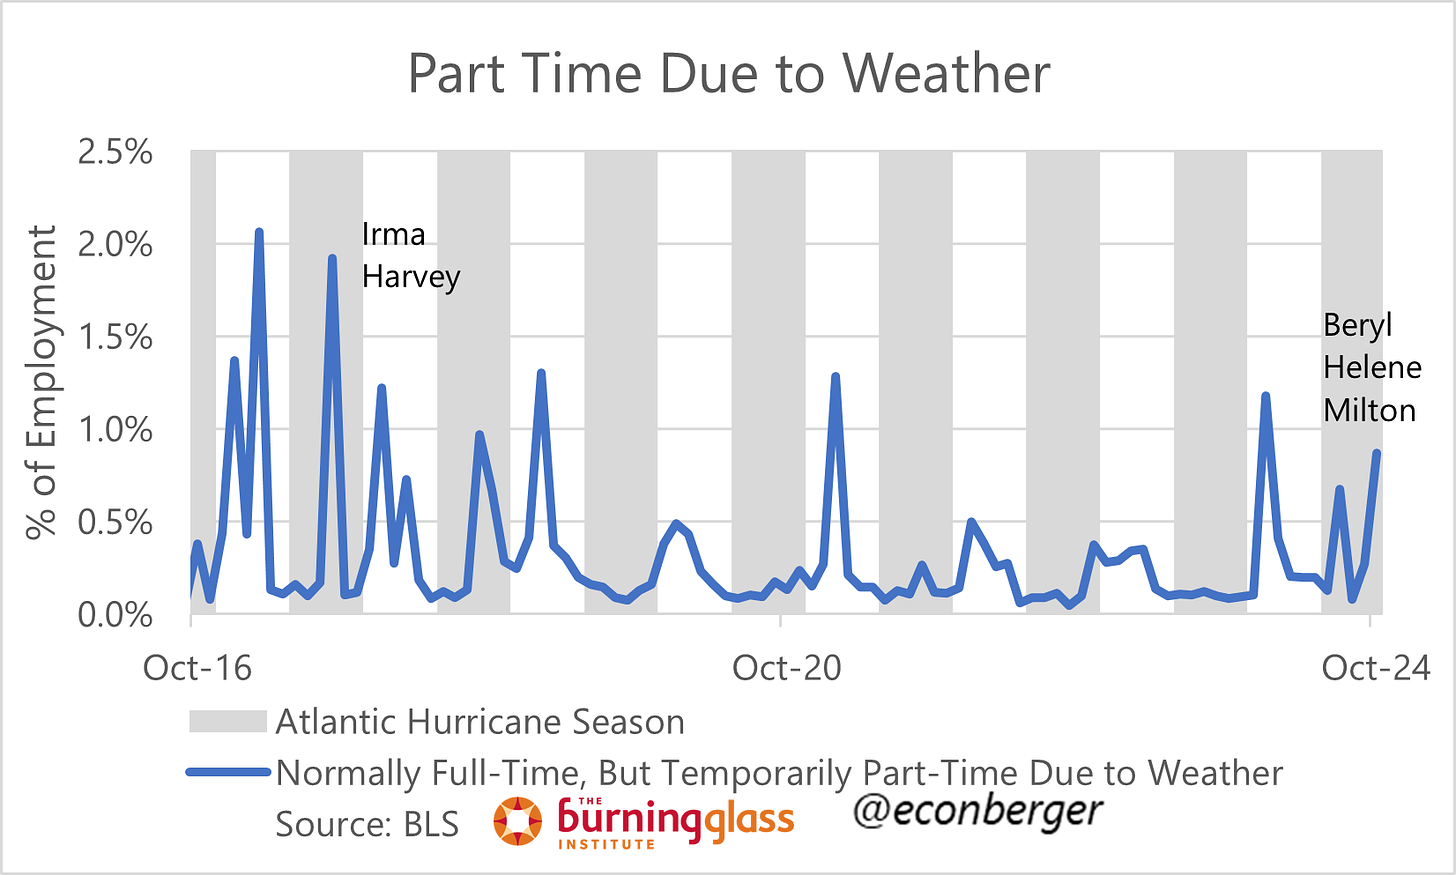
The household survey (CPS) in monthly jobs report tracks whether employed people are absent from work for various reasons, and whether people worked fewer-than-typical hours for various reasons. Both of these metrics show a large impact: 0.3% of folks with a job were absent due to weather, and 0.9% of folks with a job fit the characterization of “normally work full-time hours, but temporarily worked part-time hours due to weather”.
The impact of absences on employment is messy. Let’s start with definitions. Folks who have a job but do not get paid when absent (e.g. hourly workers) do not count as employed in the establishment survey, but do count as employed in the household survey. Taken literally this implies a potentially very large temporary dent in nonfarm payroll employment (albeit hard to precisely quantify) and zero impact on things like unemployment, labor force participation, and the employment/population ratio.
But indirect impact on the household survey is still possible. Hurricanes don’t just cause absences. Some businesses can shut down permanently, inducing job loss. And natural disasters can disrupt supply chains in areas that aren’t directly affected causing temporary furloughs. We don’t know for sure whether the October softness in employment and unemployment was indirectly hurricane-induced but we should at least consider the possibility it played a partial role.
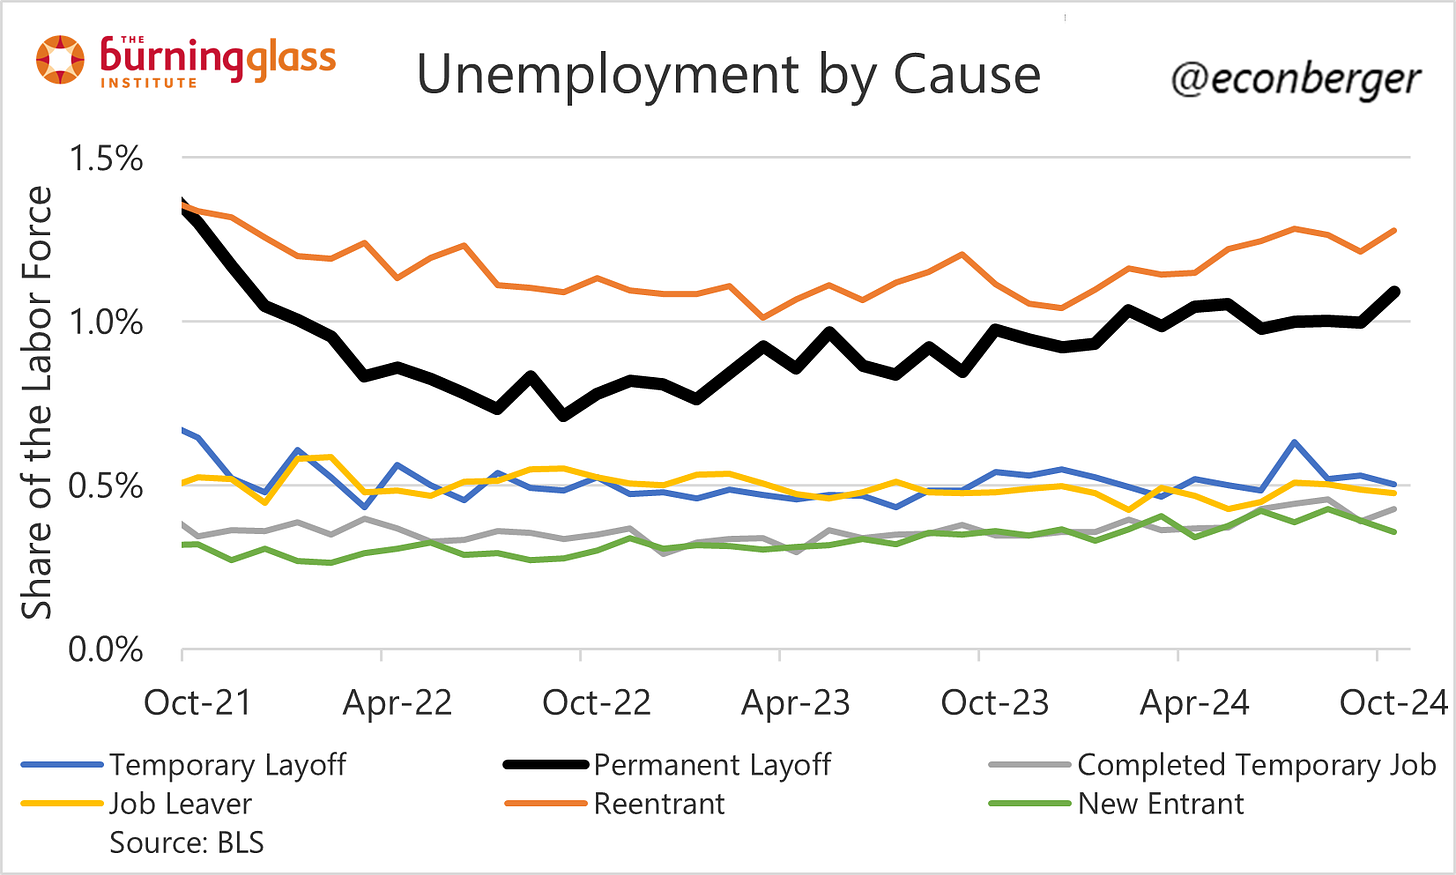
For what it’s worth, the furlough story seems inconsistent with the data in hand - unemployment due to temporary layoff and completion of temporary jobs barely moved in October.
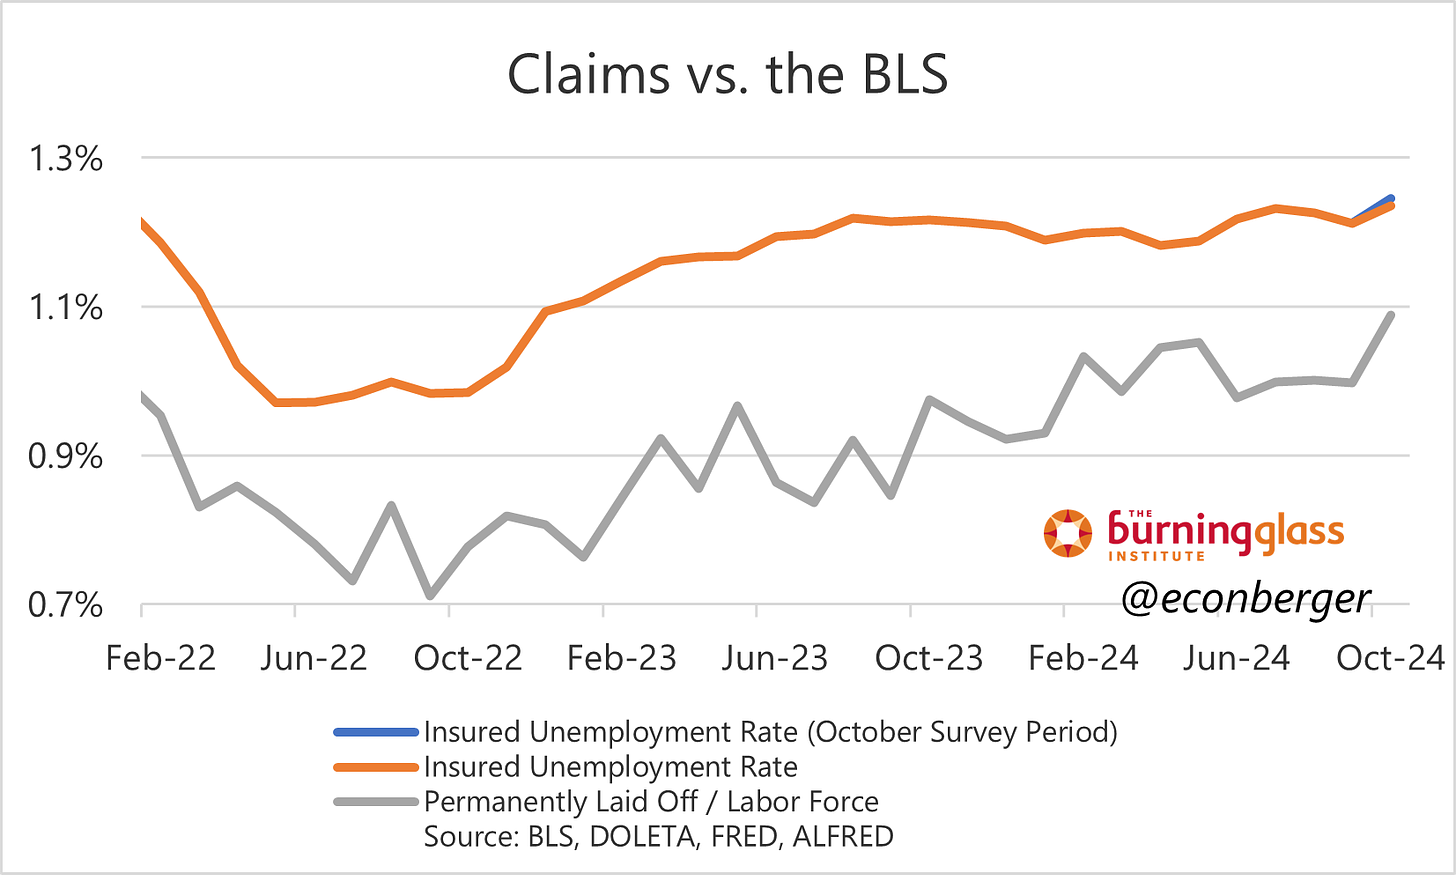
But I think there’s evidence that there was some sort of effect, because it showed up in the unemployment insurance claims data proxy for unemployment due to permanent layoffs. This indicator is already drifting down in more recent data. Whether it was hurricanes or something else, it will probably be lower in November.
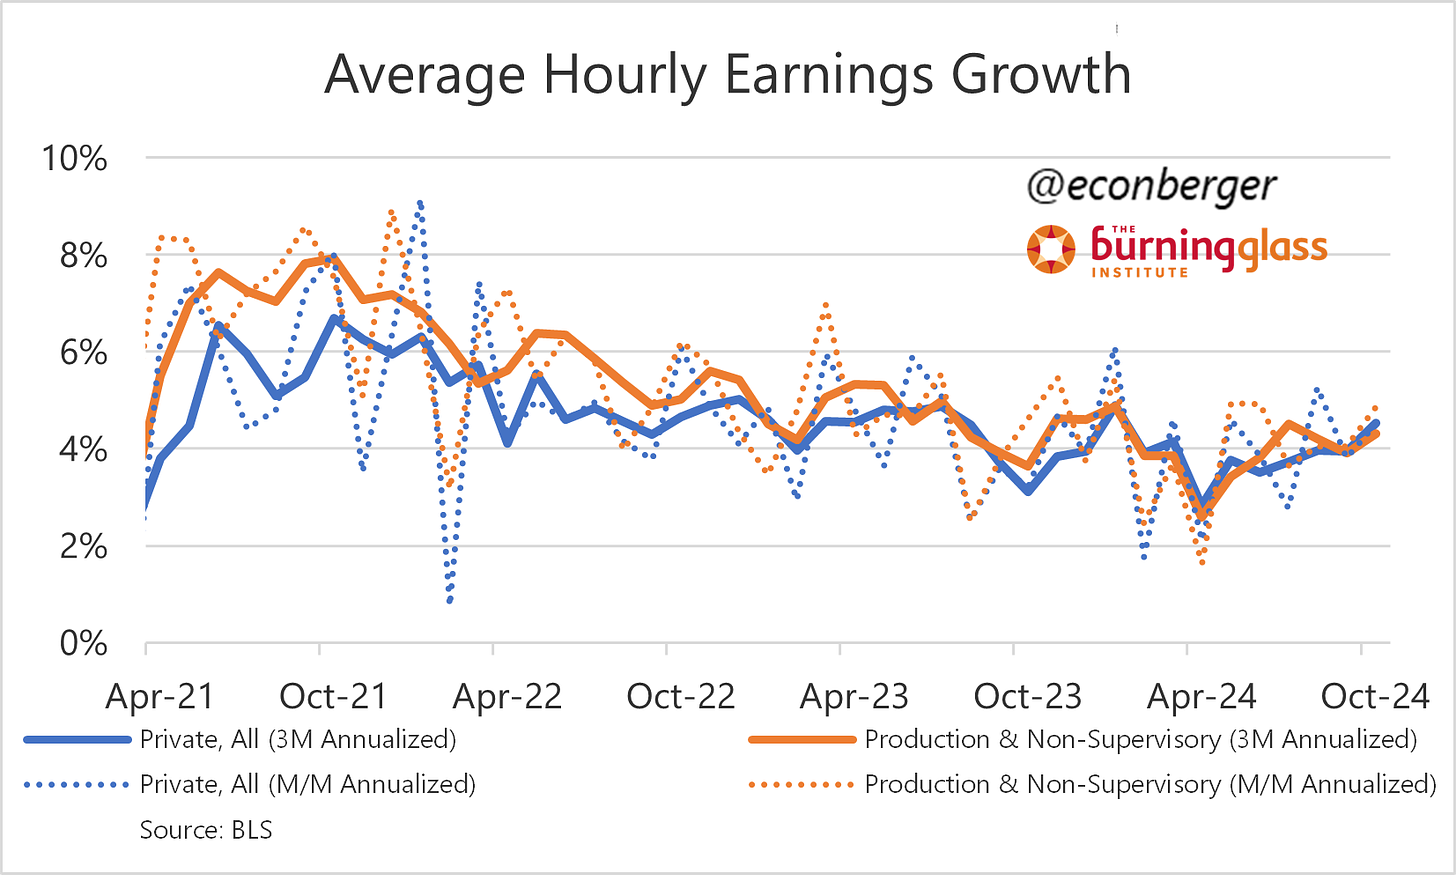
Final point - I haven’t spent much time on average weekly hours and earnings, but it’s quite possible that these data were also distorted by weather-induced absences and part time work. The effect is unclear - probably negative for hours, and positive for earnings, but I’m not sure.
To some this up, we have solid evidence that nonfarm payroll employment was affected by hurricanes, possibly by a lot - but we don’t know exactly how much. And it’s possible but not certain that the household survey aggregates like unemployment and employment also got distorted a little.
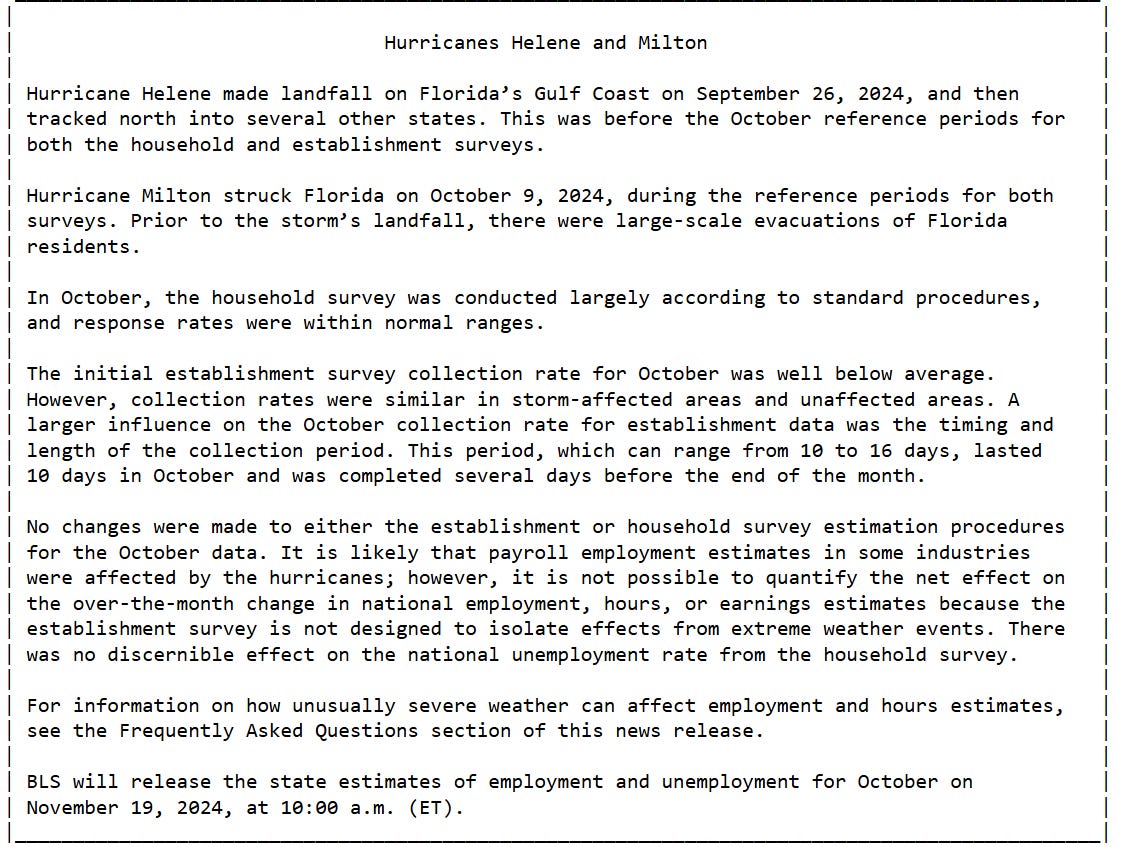
As a postscript, here’s the BLS’s methodological note on the hurricane impact.
b. Strikes
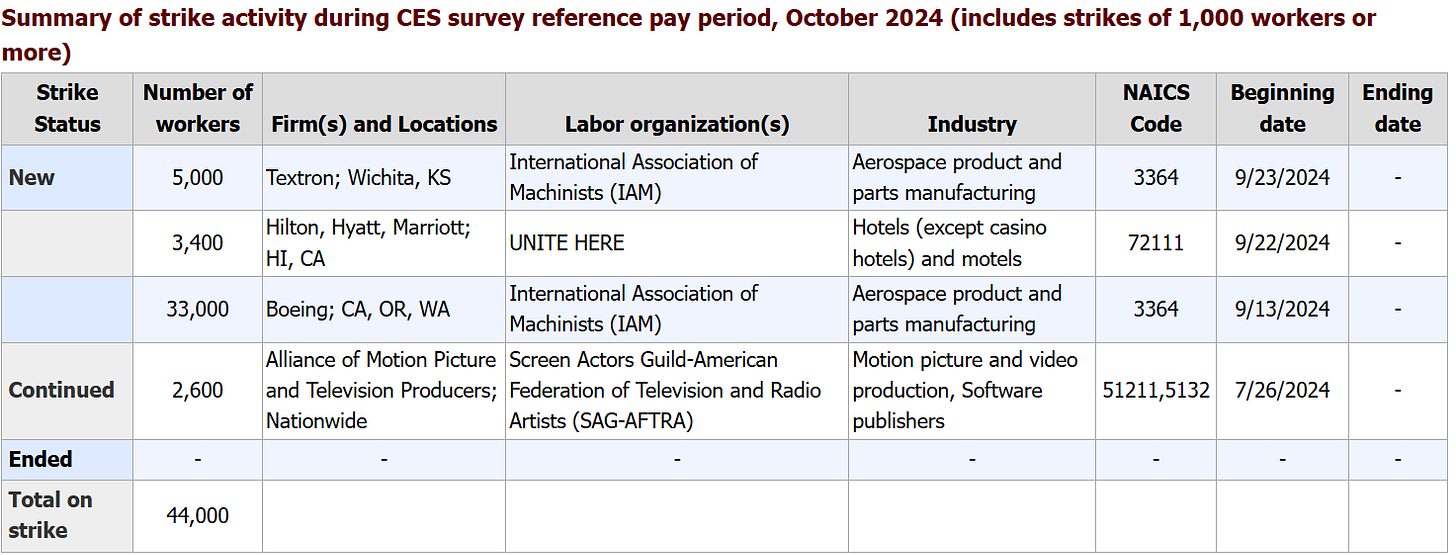
Unlike hurricanes, the direct impact of strikes is easy to quantify. The BLS collects data on the size and date of strikes, and these are fairly easy to match to data in the establishment survey. In particular, 41K workers initiated strikes leading up to the October BLS reference period, and matching most of them to the data in the report is easy. We can go so far as “if these strikes hadn’t happened, jobs gains would have been around 53K instead of 12K”.
In the household survey, striking workers are employed but absent from work - i.e. no effect on employment or unemployment data. Also, 41K is a tiny number - it accounts for only about 0.02 percentage points (0.02%) of employment, much smaller than the hurricane impacts earlier. However, the effect on supplies is once again a question mark that we can’t measure as easily.
So to wrap up, we leave November jobs day with just as many questions as when we entered. Hopefully December 6th will be more clarifying!


