TL;DR: A disappointing jobs report. Hurricane Beryl may have depressed the numbers, but the underlying trend in the labor market points in the wrong direction.
Key Data Points:
Unemployment rate: rose to 4.3% (bad, with asterisks)
Prime working age employment population ratio: rose to 80.9% (very good)
Nonfarm payroll employment: rose by 114K (soft, but possibly reflecting Beryl)
Wage growth: ~3.7-4.2% annualized over the past 3 months (a little on the high side, from the Fed’s perspective)
In the rest of this recap, I’ll discuss:
The Big Picture
Employment vs. Unemployment
Decomposing the Big Unemployment Rate Increase
Hurricane Beryl’s Impact
Full recap below chart.
1. The Big Picture
I’ve become more pessimistic about the US labor market’s trajectory in the past few months, and today’s jobs report didn’t allay that pessimism. I think monetary policy will respond adequately to growing labor market weakness and we’ll avoid recession, but such a response is necessary - it’s way too risky to try and ride it out with current interest rates.
The main point of uncertainty after this report:
Are we still on the gradual, slow path of labor market cooling we’ve seen over the past few years (non-recessionary or pre-recessionary)?
Or are we shifting into a faster and more disorderly deterioration that signals a forthcoming recession?
This is the first jobs report since 2021 where that 2nd possibility is really coming into view. I’ve talked about 4 tripwires I’m following closely to assess recession risks, and I think they provide a good framework for assessing the uncertainty above:
Consistent, ongoing increases in the unemployment rate each month?
A lurch downward in nonfarm payroll growth?
Renewed declines in the JOLTS data on hires and quits?
Declines in prime-working age employment?
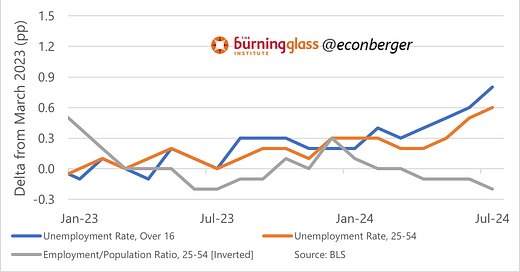
Only one indicator on this list has shifted from yellow to red - the unemployment rate. We saw a big increase in July, 0.2 percentage points. That’s the highest since the fall of 2021. If we keep seeing increases of this magnitude month after month, it’s going to get hard to argue we’re not edging toward recession.
But even if we revert to a slower rate of increase (we saw the unemployment rate increase by 0.4 percentage points from January to June) it will be a concerning development
I think the increase in the unemployment rate merits some additional discussion, so section 2 of this recap will be devoted to it.
But back to my tripwires. I discussed the JOLTS data earlier this week - I’d characterize it as yellow rather than red. And I’d put the nonfarm payroll employment data in the same bucket. We’ve clearly had a downshift in employment gains over the past few months - from over 200K per month to around 170K (the 3 month moving average). And while I’m inclined to think we’ll see some positive payback next week as the Hurricane impact reverses, job growth is likelier to decelerate than to accelerate over the next 6 months.
The one pillar of the job market that’s still standing strong - GREEN! - is the prime working age employment population ratio, which rose in July to 80.9%, matching its cyclical high as well as the post-2001 record. It’s hard to get too pessimistic about the pessimistic about the job market until this indicator turns over. That said, I don’t know how long the current strength can last given the way the rest of the data is trending.
Coming into today, we had one green pillar and three yellow ones. Now we have one green, two yellows, and one red. That’s not a direction I enjoy travelling in.
2. Employment vs. Unemployment
One thing that’s unusual about the current environment is the large and widening divergence between the unemployment rate and prime working age employment. Over the past 16 months, the unemployment rate has gone up by 0.8 percentage points (and the prime working age employment rate has gone up by 0.6 percentage points). Simultaneously, the prime working age employment/population ratio has increased by 0.2 percentage points.
The increase in unemployment is normal for pre-recessionary and recessionary periods. But the increase in employment is not. Usually these indicators row in concert. Heading into the 2001 recession, we saw employment decrease and unemployment increase.
Same with the leadup to the 2008-09 Great Recession. In the fall of 2007 there was some uncertainty about whether we were tipping into recession, but no ambiguity about the labor market cooling.
The degree to which rising unemployment is not (yet) showing up in lower employment so far isn’t entirely reassuring about our future trajectory, but is somewhat reassuring about our present state.
3. Decomposing the Big Unemployment Rate Increase
The BLS kindly breaks up unemployment into several categories. And the large increase in unemployment during July has some interesting quirks.
The first, and particularly significant, is what has held steady since February (and really, hasn’t increased much since October): “unemployment due to permanent layoff”. In the 2001 and 2008-09 recessions, this was the single most important cyclical driver of unemployment leading up to and during recession.
For what it’s worth, if the labor market continues to cool, going forward I’d expect this segment of unemployment to increase. And we don’t need a pickup in layoffs to cause such an increase - all that’s needed is a decline in hiring that makes it harder for the current flow of laid off folks to find a job.
The second, and specific to the July data, is an unusual surge in people on “temporary layoff” who expect to be recalled to work. This alone accounted for about 0.13-0.15 percentage points of the overall 0.2 percentage point increase in the unemployment rate.
My initial assumption was that this reflected the impact of Hurricane Beryl (see section 4), but conversations folks like Talmon Smith and Julia Coronado have had with BLS suggest that is probably not the case. Regardless, it’s unusual in general, and has not been a characteristic of pre-recessionary labor markets in the post-1990 period. My baseline expectation is this will reverse next month.
The third factor, and one that has been more gradual, is the increase in labor force re-entrants - its increase has accounted for about half of the unemployment increase this year. This can be a good or bad thing. In recessions, it tends to go up - there are more jobless folks drifting in and out of job search - but contributes less to the overall unemployment rate increase than permanent layoff.
I’m less convinced it’s a bad thing so far, as long as prime working age employment holds up; “bad re-entry” is something I associate with job losses that we aren’t seeing yet.
4. Hurricane Beryl’s Impact
BLS added an interesting disclaimer to today’s report:
This generated a whole lot of controversy about whether today’s numbers were, in fact, affected by the Hurricane.
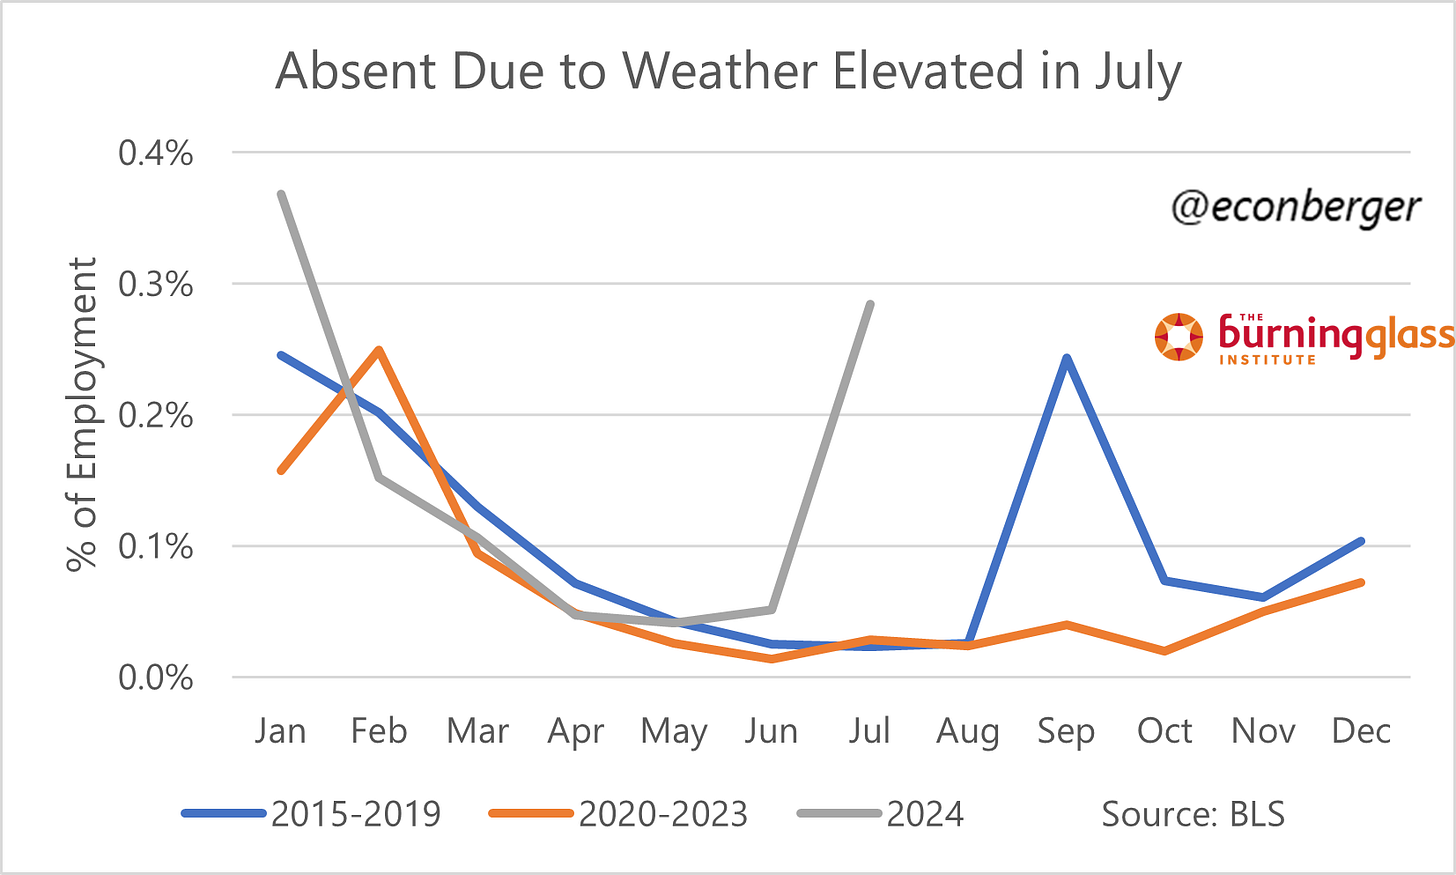
Some of the numbers certainly were! For example, there was an unusually high number of employed people who missed work due to weather.
A lot of people who normally work full-time also ended up working only part-time hours due to weather.
In the establishment survey, weather-driven part-time work could drive a lower average workweek. And weather-driven absences for hourly workers could drive lower employment counts - if workers are not paid at all, they might not count as employed. The San Francisco Fed estimated that bad weather subtracted about 15K-35K from July’s employment gain - to the degree this is true, we should expect a temporarily stronger number next month (naively, between 144K and 182K).


Well covered. Thank you