TL;DR: Forecasters expect another month of solid job gains in May, but without an improvement in unemployment.
In the rest of this preview, I cover:
The Big Picture
Point: The Cooling Is Over
Counterpoint: Gradual, Non-Recessionary Cooling Is Ongoing
Recent QCEW Data and Future Revisions
More below chart.
1. The Big Picture
For as long as I’ve been writing these BLS previews on substack, my recurring question has been: Is gradual labor market cooling ongoing, or is it in the rear view mirror?
Even if you’re sick of that question, I’m going to ask it again this month. We continue to see metrics providing a range of answers ranging from “things cooled in the recent past, but are now stable” to “gradual, non-recessionary cooling is ongoing”. My weakly-held, low-confidence opinion is the latter is correct.
(What we definitely don’t see in the data: “rapid recessionary cooling”.)
I don’t anticipate Friday’s report will settle this debate for once and for all, but one thing is certain: I’ll opine on how the data shifts my relative weights for those two scenarios.
A. Point: The Cooling Is Over
On the stability side, both the unemployment insurance data and the JOLTS data indicate that things are stable. Indeed, layoffs are lower than they were a year ago. This data acknowledges that cooling did happen, but it’s in the rear view mirror.
This is also something that’s apparent in the JOLTS hiring and quits data - quits stopped falling last fall.
Nonfarm payroll gains have been fairly steady over the past year. (I’ll write about possible downward revisions to this data later in this piece.)
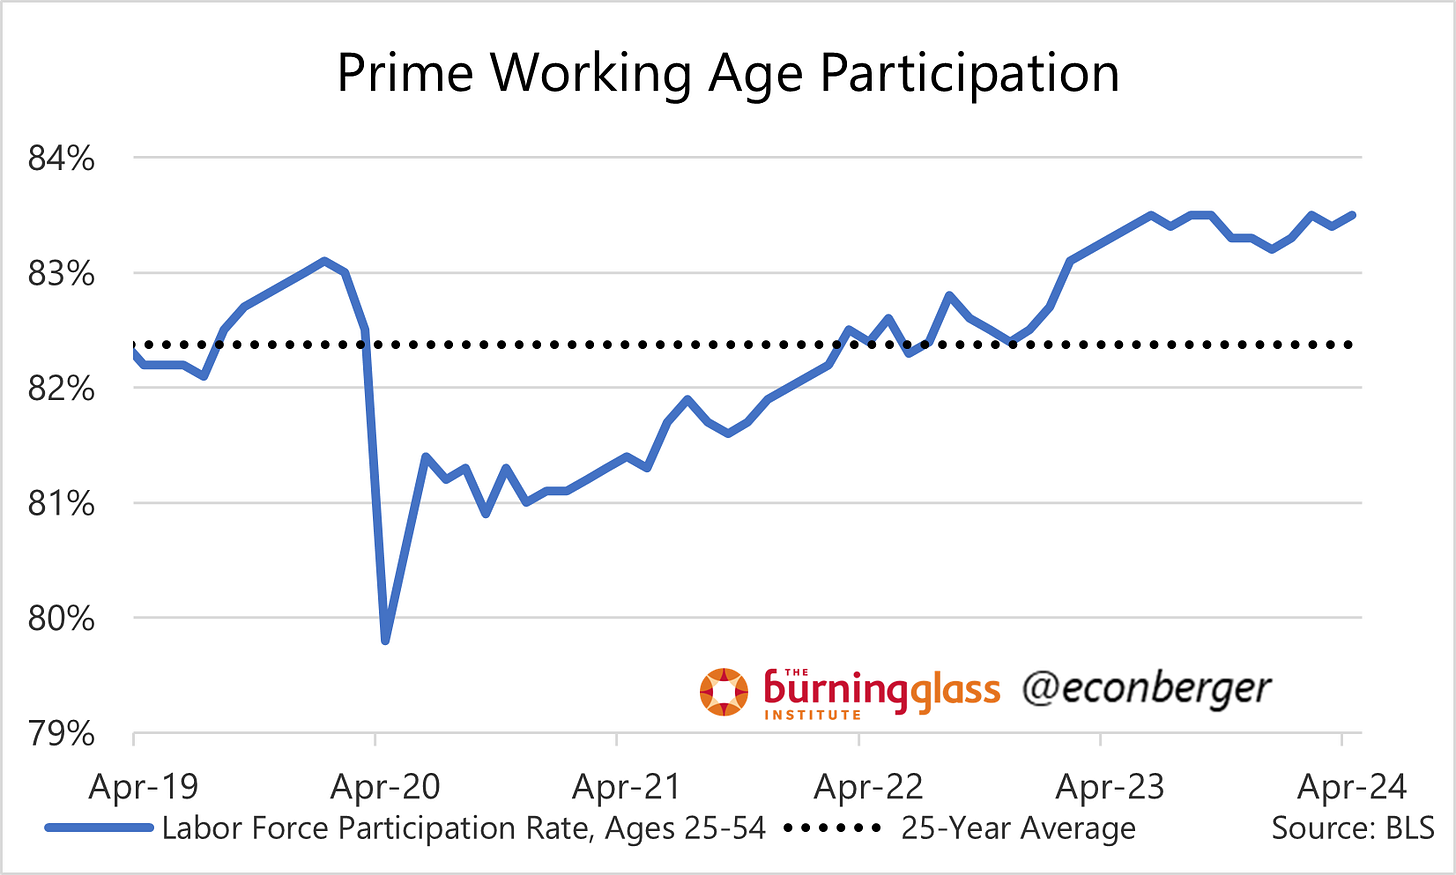
And, though the household survey data has mostly been on the downbeat side, it’s worth noting that the share of prime working age Americans with a job has rebounded recently and is just shy of its all-time high. And prime working age labor force participation is at a post-2002 high.
B. Counterpoint: Gradual, Non-Recessionary Cooling is Ongoing
A lot of the household survey data, though not prime working age employment and labor force participation, have cooled over the past 12 months - and in some cases, the cooling could still be ongoing.
Most significant is the unemployment rate, which has gone up by a few tenths of a percentage point.
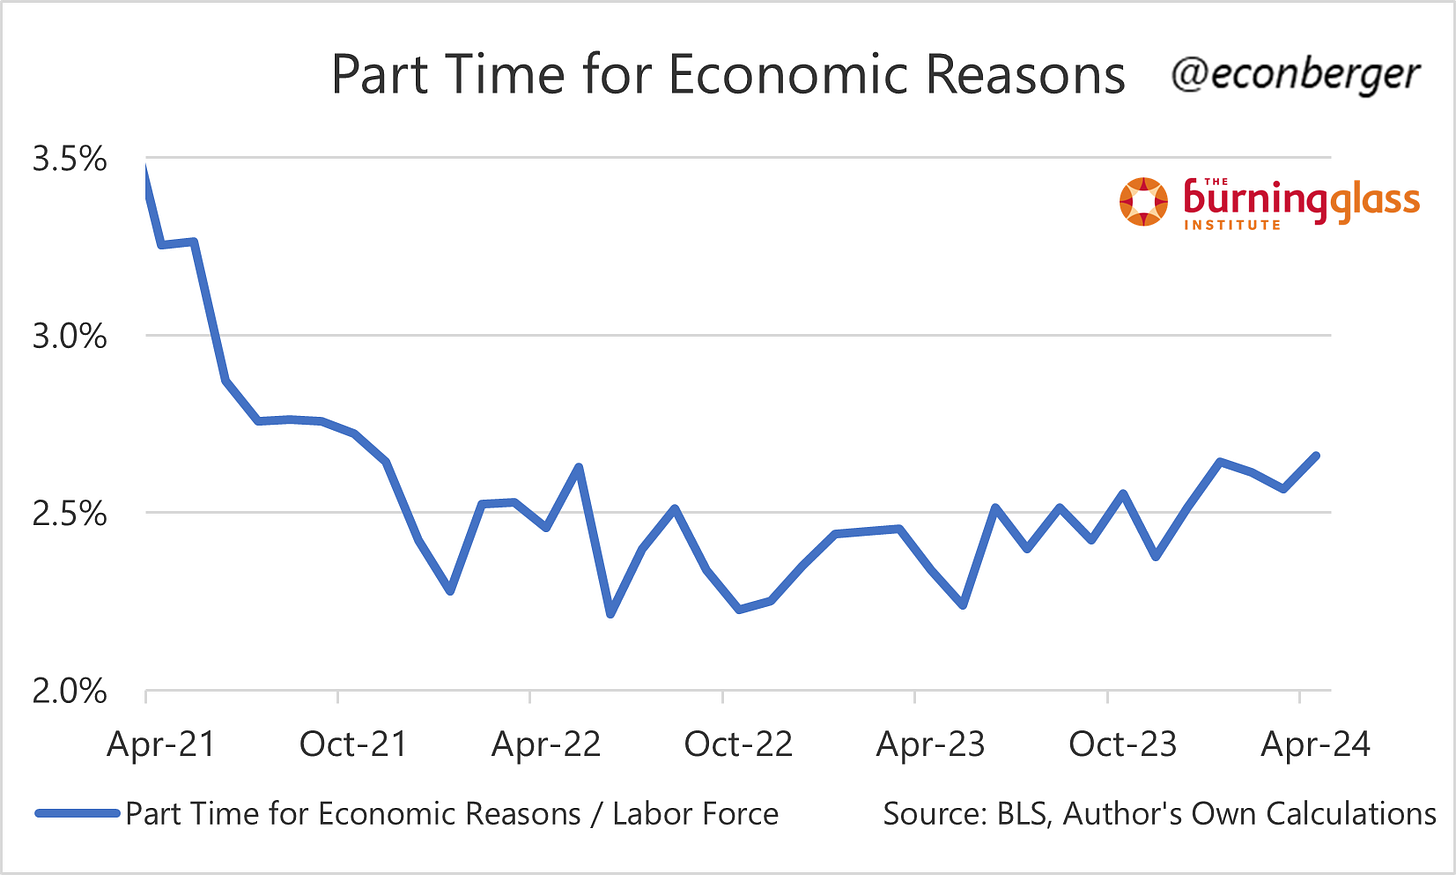
We’ve also seen a very small increase in the share of folks working part time for economic reasons.
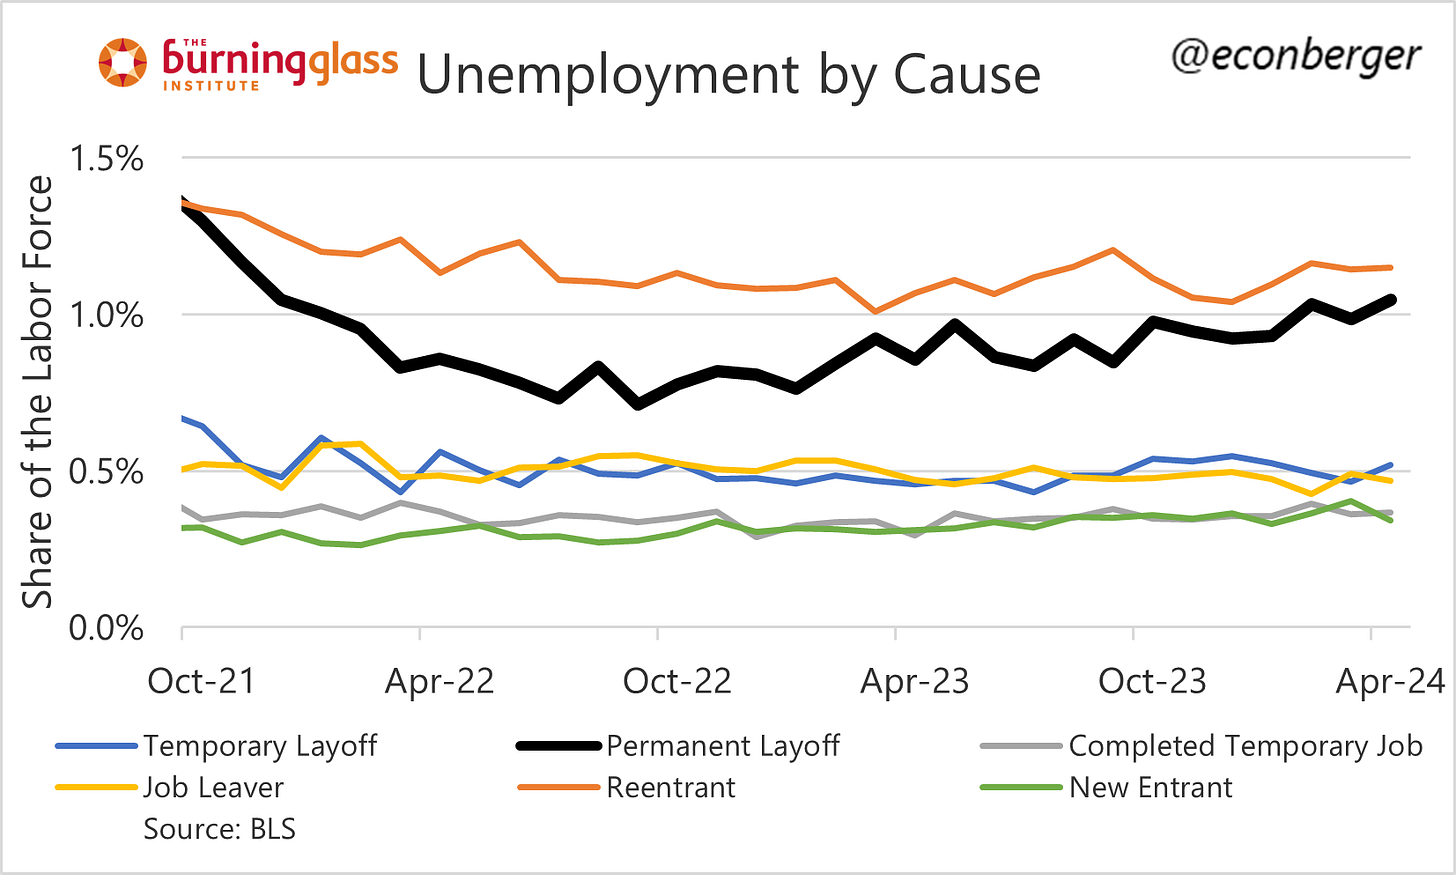
And we’re seeing a very slow creep upwards in the share of people who have been permanently laid off. (This is somewhat in tension with the continuing claims data.)
I’ll be much more comfortable with the “cooling is behind us” thesis when we see these household survey measures send an unambiguous signal of “not going up anymore”.
Before I wrap up this section, worth mentioning that wage growth took a lurch downward in April (to pre-pandemic growth rates of around 3% annualized). Did this continue in May?
2. Recent QCEW Data and Future Revisions
The Quarterly Census of Employment and Wages (QCEW), based on unemployment insurance records, is used for the annual benchmark revision of the Current Establishment Statistics (CES), also known as the “establishment survey”. The QCEW data is released quarterly (with roughly a 5-6 month lag), and the Q1 release (which comes out in late August, then revised in November) is used to create the CES benchmark revision.
However, a cottage industry has emerged among economists skeptical about recent strength in nonfarm payrolls to look at intra-year releases of the QCEW and attempt to infer future revisions. After the Q3 2023 QCEW release in mid-February, it was noted that the CES employment count in the year through September 2023 was running 867K ahead of the QCEW count over the same period. At the time I warned that benchmark revisions predictions after 2 quarters of QCEW data were often dicey; QCEW data are much noisier than CES data, and projecting future benchmark revisions based on just two quarters of data generates some big errors historically.
But as of 2 weeks ago, we now have 3 quarters of QCEW data and a 735K gap between the two series. (Let it be noted - this is smaller than the prior quarter’s estimate!) Over the past 5 benchmark revision cycles, these “3 quarter estimates” have been substantially closer to the final revisions than the “2 quarter estimates”. In other words, the chances that we’ll have non-trivial negative revisions to the March 2024 level of nonfarm payrolls has increased sharply.
That said… we still have one more quarter of data. In each of the past 5 years, the final benchmark revision was more positive than than the 3 quarter estimate; the median improvement was 59K, and the average improvement was 150K. Based on that pattern, we’re probably due for a downward revision of roughly 50K-55K per month. (Of course, it’s possible that Q1 data will throw a wrench in this!)
It’s worth thinking through the implications of such a revision. I don’t think they’re very big. It would lower the nonfarm payroll gains of the past year from “very strong” to… “pretty solid”.


The great holding pattern! JP’s comments in 25 minutes should be interesting given the good news from CPI and Elizabeth Warren’s letter urging him to cut rates since the ECB already started.
ADP comparisons?