

TL;DR: After an extended period of relative stability, labor market cooling has resumed. While the core of the labor market is holding up OK for now, its fringes are hurting.
Key stats:
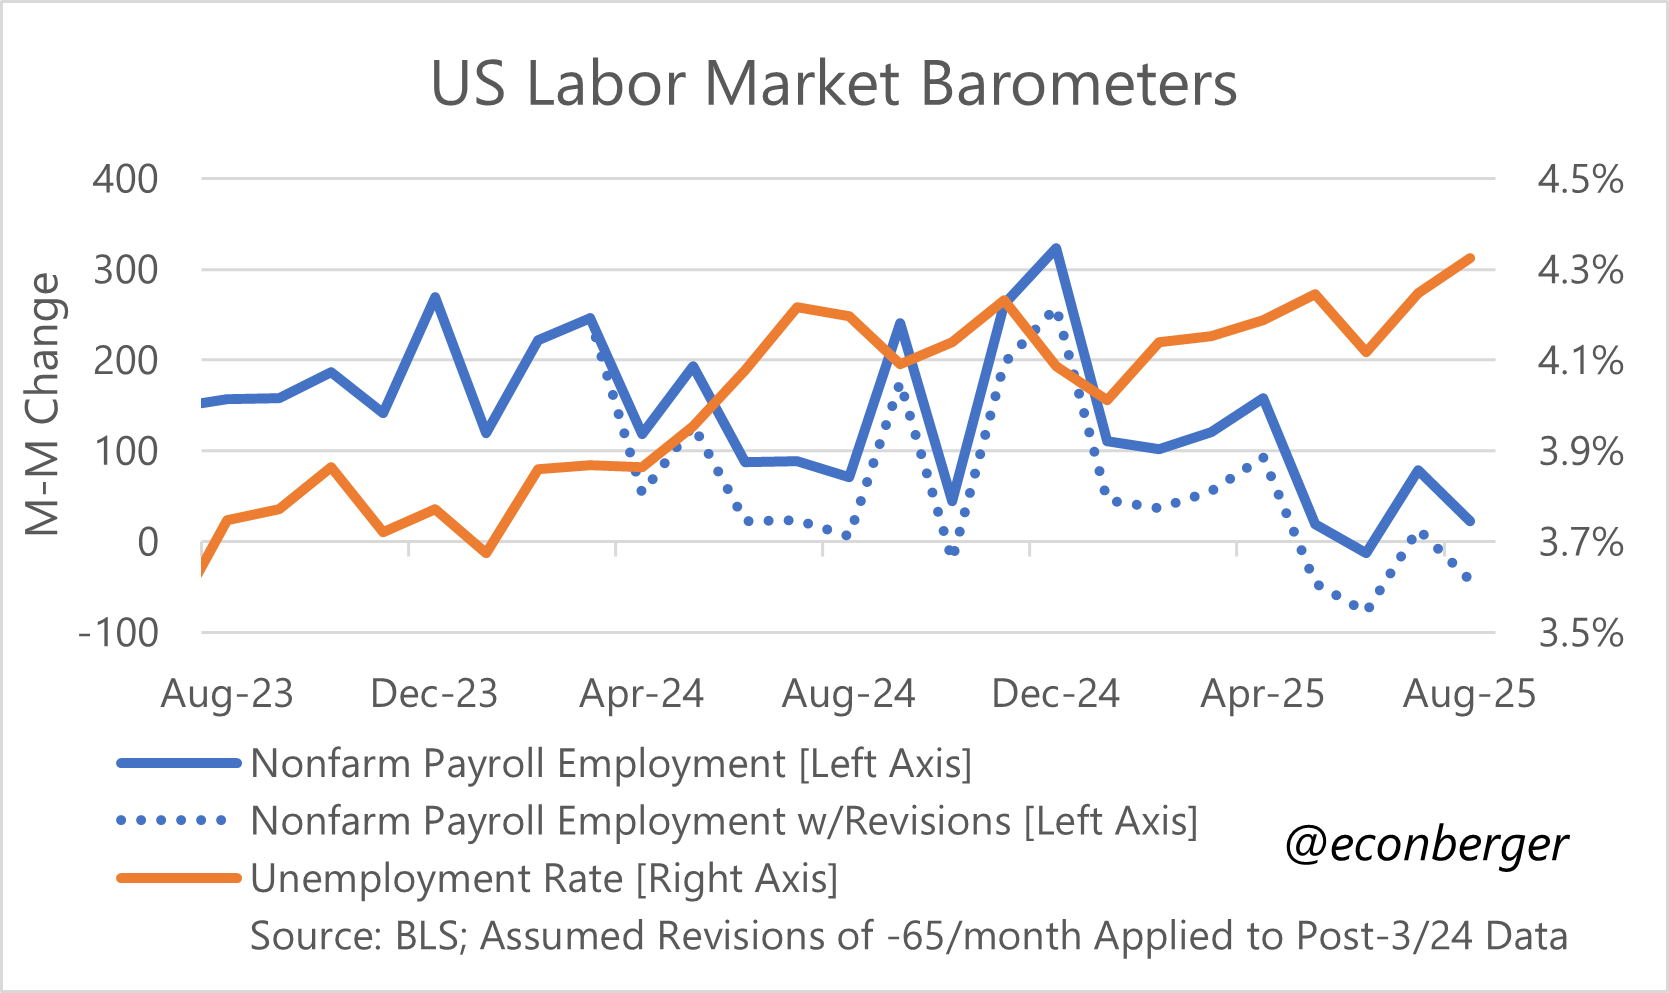
Unemployment Rate: Rose to 4.32%, its highest level since October 2021 (Bad)
Nonfarm Payroll Employment: Increased at a below-breakeven rate of 22K (Bad)
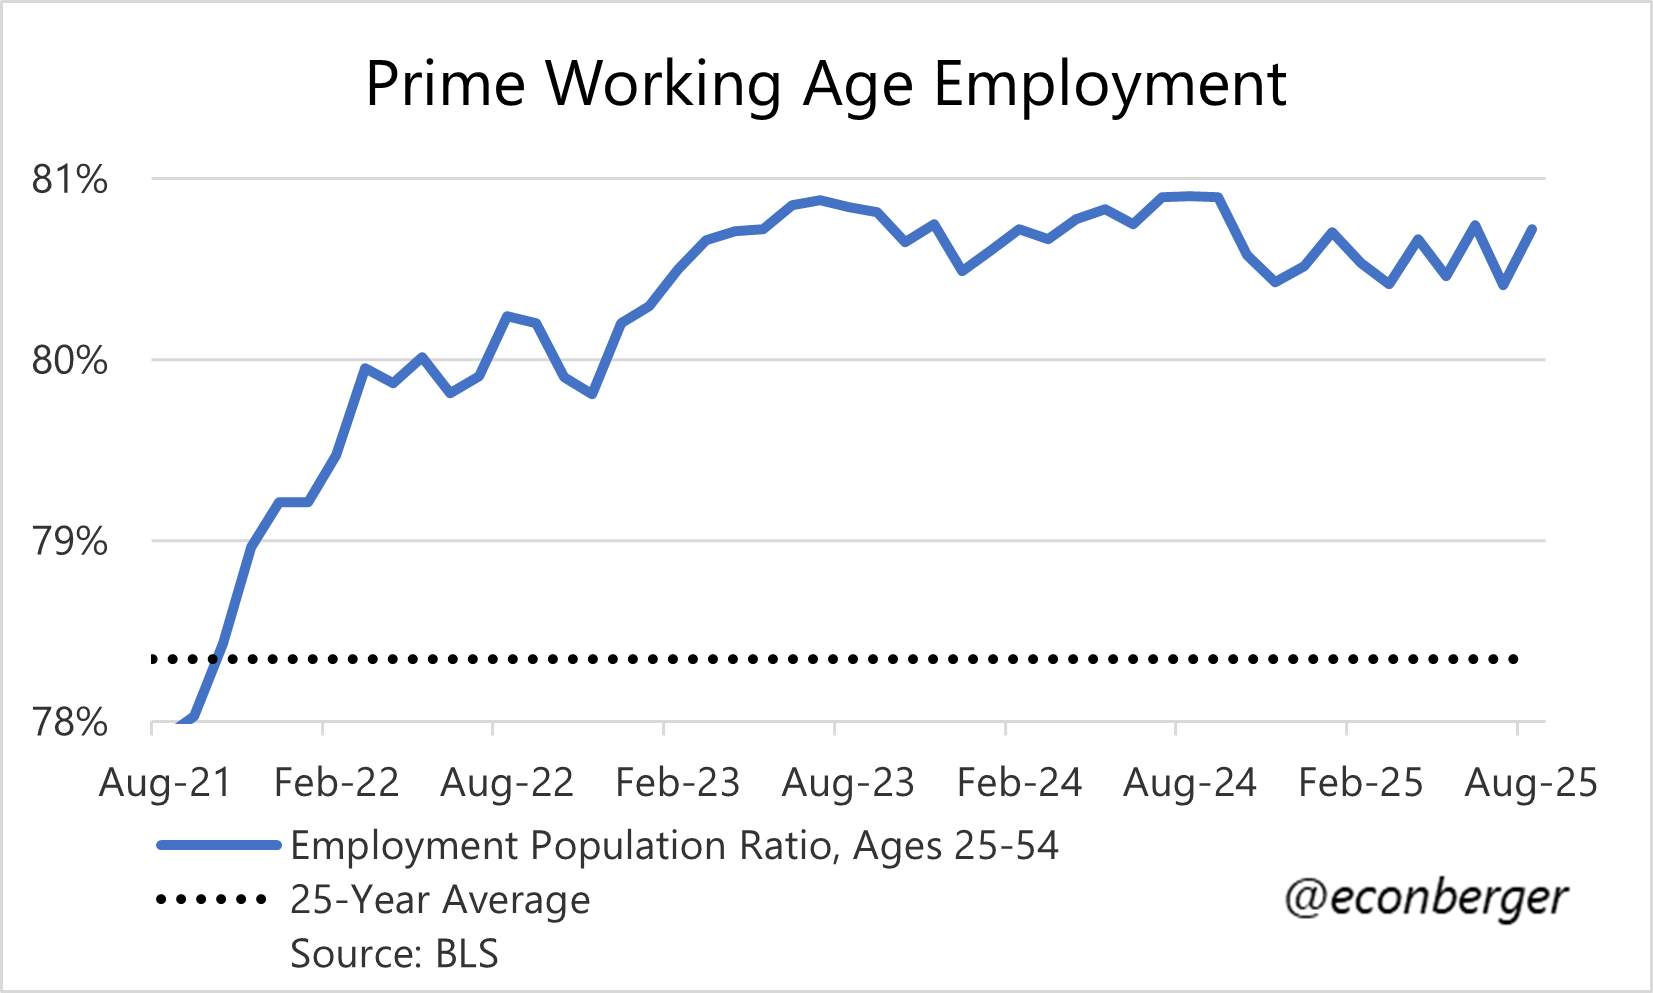
Prime working age employment population ratio: rose to 80.7% (Good)
The rest of this piece is split into
In Praise of High Quality Government Statistics
The Big Picture
Data Rundown
A Youth Unemployment Crisis, Not a College Grad Unemployment Crisis
A Reminder About Next Week’s Benchmark Revision
More below chart.
1. In Praise of High-Quality Government Statistics
Given everything that’s going on, I’m relieved that so far data in the monthly BLS report remain trustworthy. We are fortunate to have, for now, high-quality and untampered-with government statistics. I'm hoping against hope that the administration reconsiders its plans.
2. The Big Picture
Through July’s jobs and JOLTS reports, I was comfortable arguing that the job market was stable; key turnover data, as well as most ratios from the household survey, had been stable for some time, despite low growth in nonfarm payroll employment. I also wrote in my preview of the August jobs report that:
I don’t know what August’s data will look like. Some folks I respect have a strong conviction that it’s the first step in another non-trivial run-up like the one we saw between January and July 2024 (or perhaps something bigger). That’s well within the realm of possibility, but I’d characterize that as speculation about “data yet to come” - not something that’s latent in “data we’ve seen so far”. For what it’s worth, an unemployment rate of 4.3% (what the median economist forecaster expects) would tip me closer to the pessimist camp.
Well, here we are, with an unemployment rate a hair above 4.3%. Not everything in today’s report was bad, but more of it was bad than last month. And while the usual monthly noise means this bad report could be followed by a good one, the job market will probably look at least a little worse in 3-6 months than it does today. I’ve talked about a “tug of war” between weakening labor demand and weakening labor supply; weakening labor demand is gaining the upper hand. Or to use a totally different analogy, the labor market is failing to keep up with even a lower speed limit.
One theme you’ll see in the next section: the job market’s core is doing OK (prime working age Americans). Layoffs remain relatively low, and these individuals can hunker down in their current jobs even if hiring is down a lot. But the fringes of the labor market are looking more and more frayed. Younger people are seeing an increase in unemployment; so are African Americans. These slices of the labor market are more sensitive to fluctuations in demand. I don’t want to get too hung up on whether these fringes are leading indicators or “canaries in the coal mine” (though, if labor demand keeps worsening, they will be). It’s enough, for now, to say that these edges have worsened enough to put a dent in the aggregate numbers.
There are two side-themes I want to add before continuing to my data run-through. The first is that I’m intensely skeptical of arguments that “the economy is basically fine, it’s just a job market problem.” I think the odds of a weakening labor market coupled with strong GDP growth are low.1 I also wouldn’t bank on the resilience of GDP nowcasts and near-term forecasts; these will lag the labor market data, and if the latter worsen, the former will too.
The second sub-theme is one I’ve been talking about for a while: hiring and layoffs. The first wave of labor market cooling from late 2021 through mid-2024, and the probable second wave that started recently, are mostly a function of falling hiring. Hiring has more room to fall if the labor market worsens, and so this insider/outsider fork could widen. But it is also worth pondering how bad things could get before layoffs start going up - the kind of thing that would shatter the core’s resilience.
Anyway, onto the data…
3. Data Rundown
I’ll start with a little bit of good news. Our best single indicator from this report, the share of prime working age Americans with a job, rose to 80.7% in August. It’s been pretty stable for almost a year. This is the labor market’s resilient core.
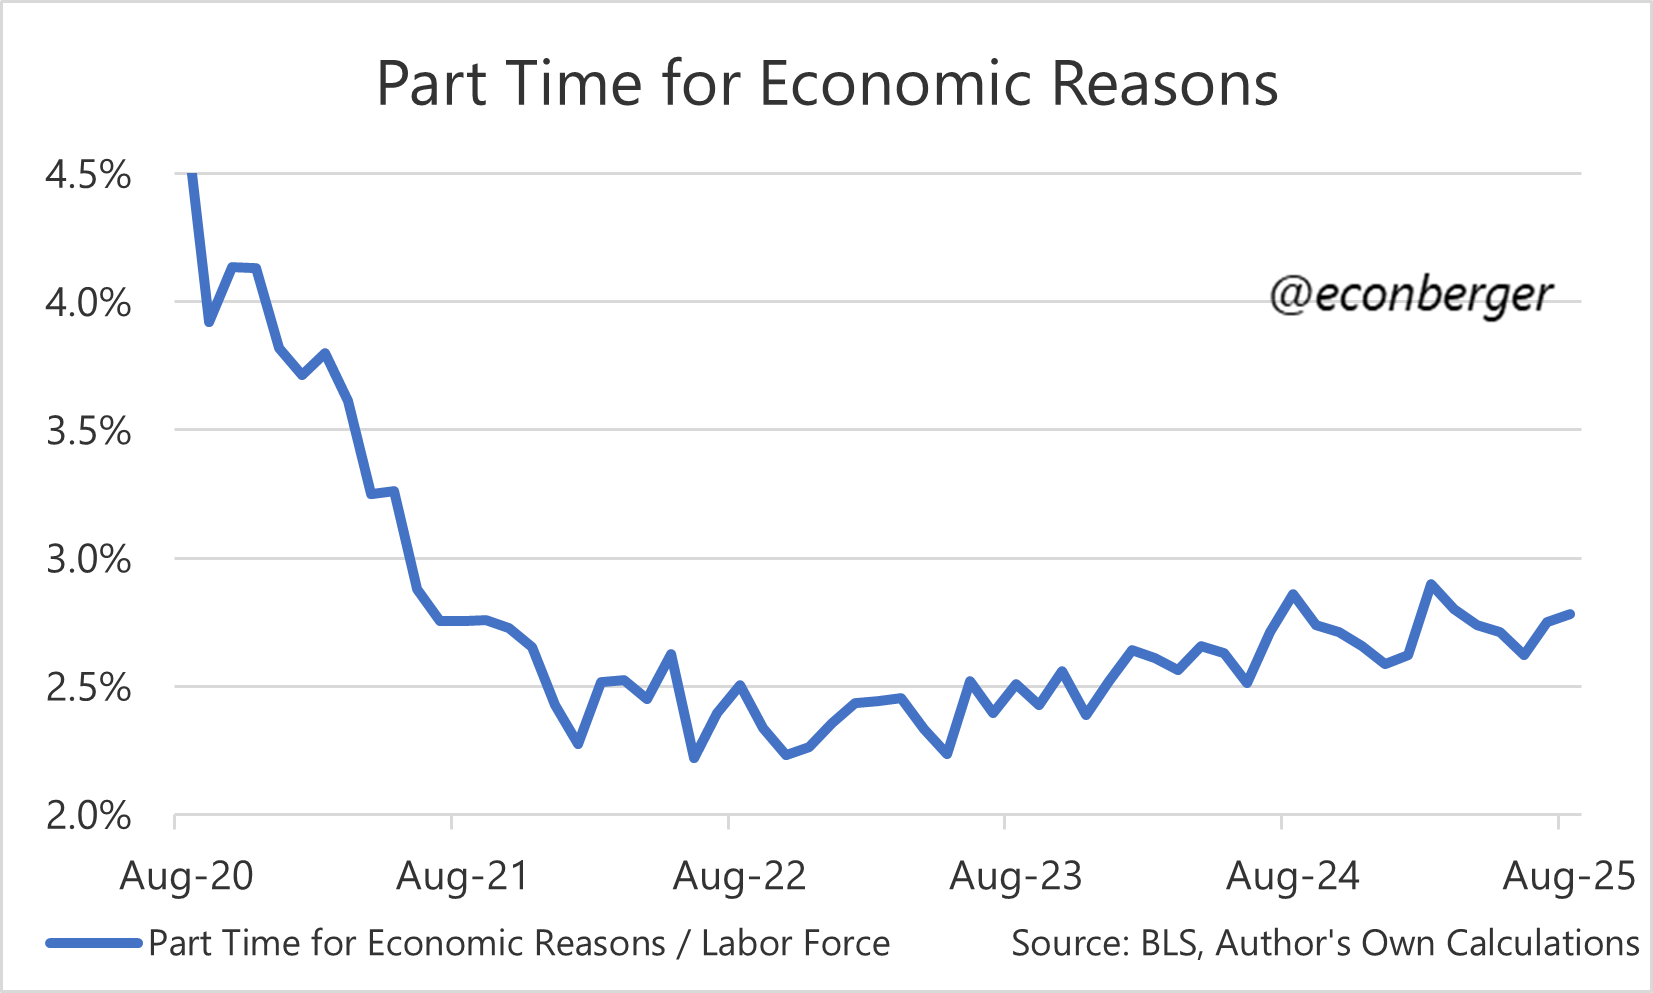
Next, I’ll move to a few pieces of data that I’d characterize as lukewarm but not bad (yet). The share of the labor force working part time for economic reasons (they want to work full-time hours but can’t get them) went up a little in August, and maybe is trending up a little, but doesn’t look out of whack with its range over the past year.
Another bit of data that looks OK is “unemployed due to permanent layoff”. It’s a little higher than it was last year, but like continuing claims (a useful proxy) has been flat for a few months. This is the category that you see lurch upward during recessions.
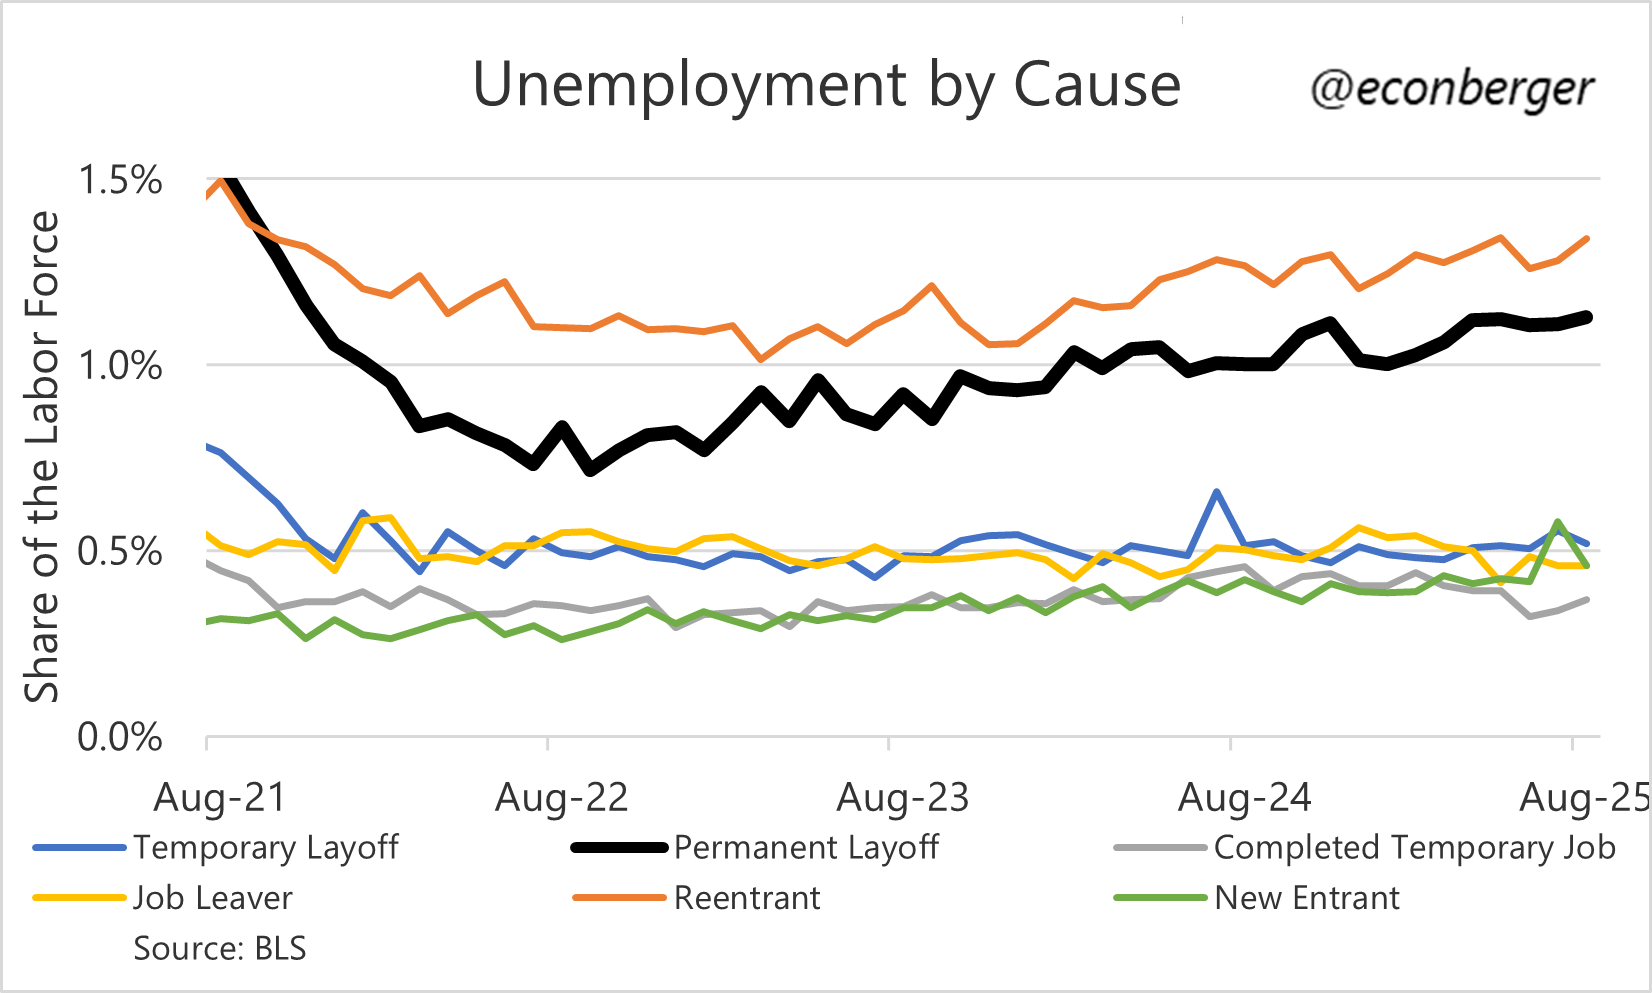
However, given talk of labor market fringes, I also want to highlight higher unemployment among new entrants (green) and re-entrants (orange). A lot of these are younger people entering the job market for the first time (teenage high school grads) or after a period of education (recent college grads in their early 20s). Both of these are higher than they were a year ago.
And that brings us to unemployment by age. We had a welcome decrease in the unemployment for people in their late teens, but for people in their early 20s it rose to 9.2%, its highest level since the spring of 2021. The hiring slowdown is hurting America’s younger workers. (I’ll discuss this more in the next section.)
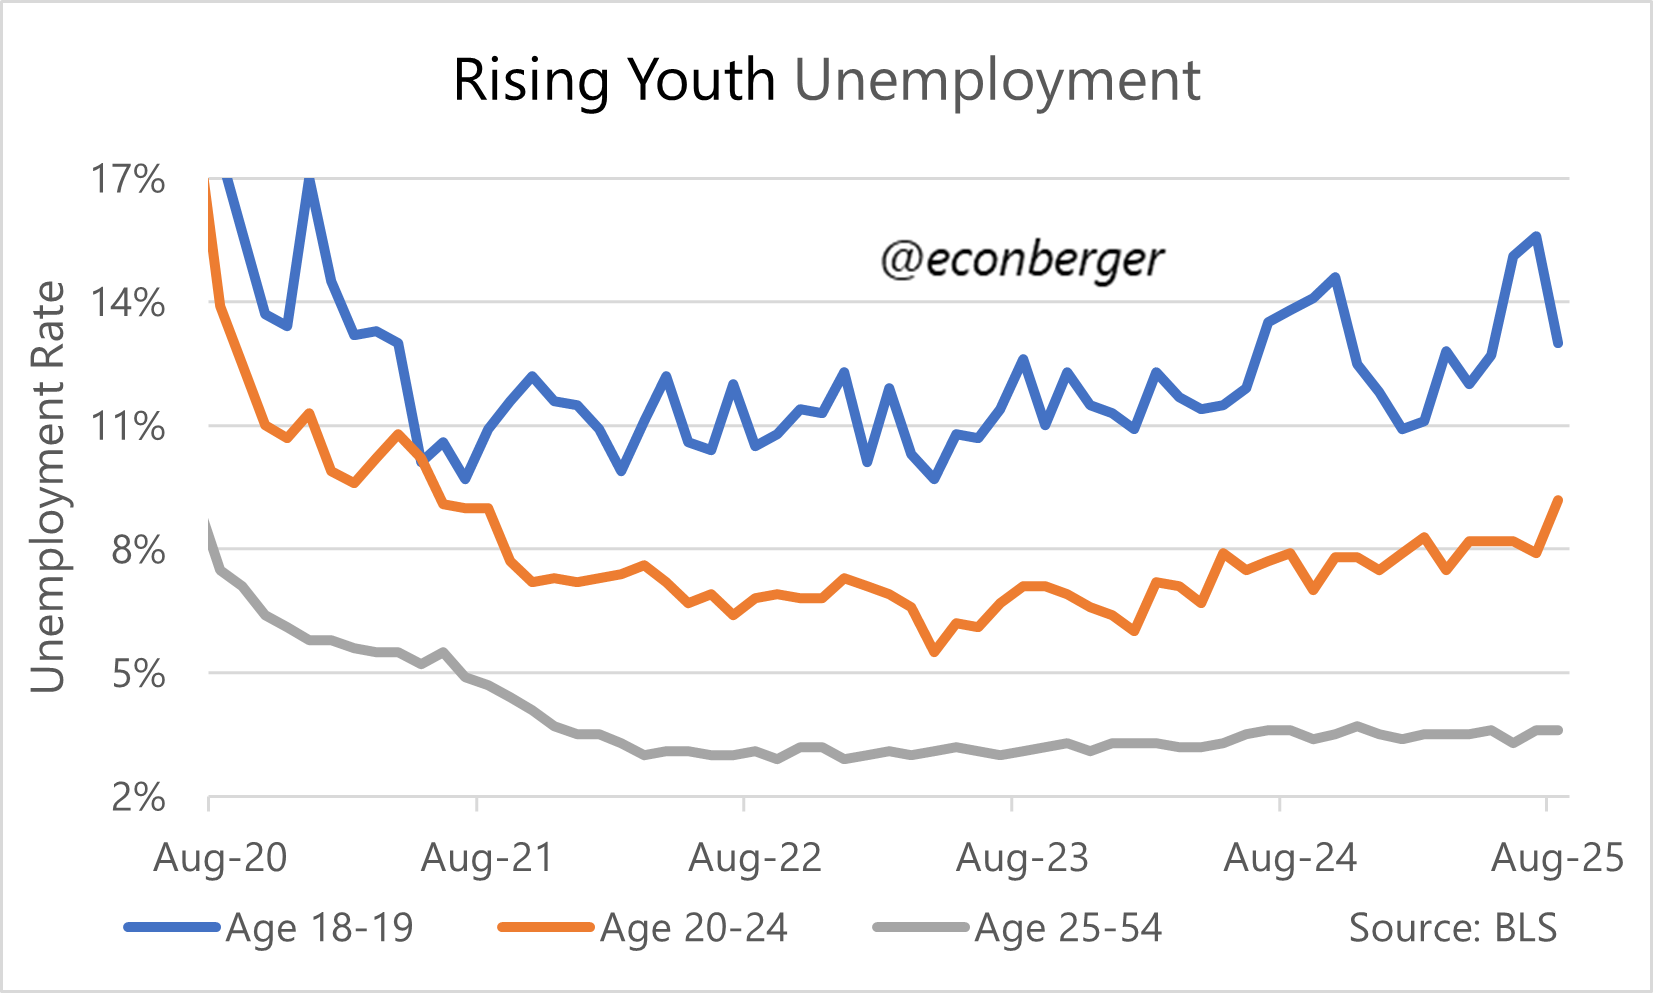
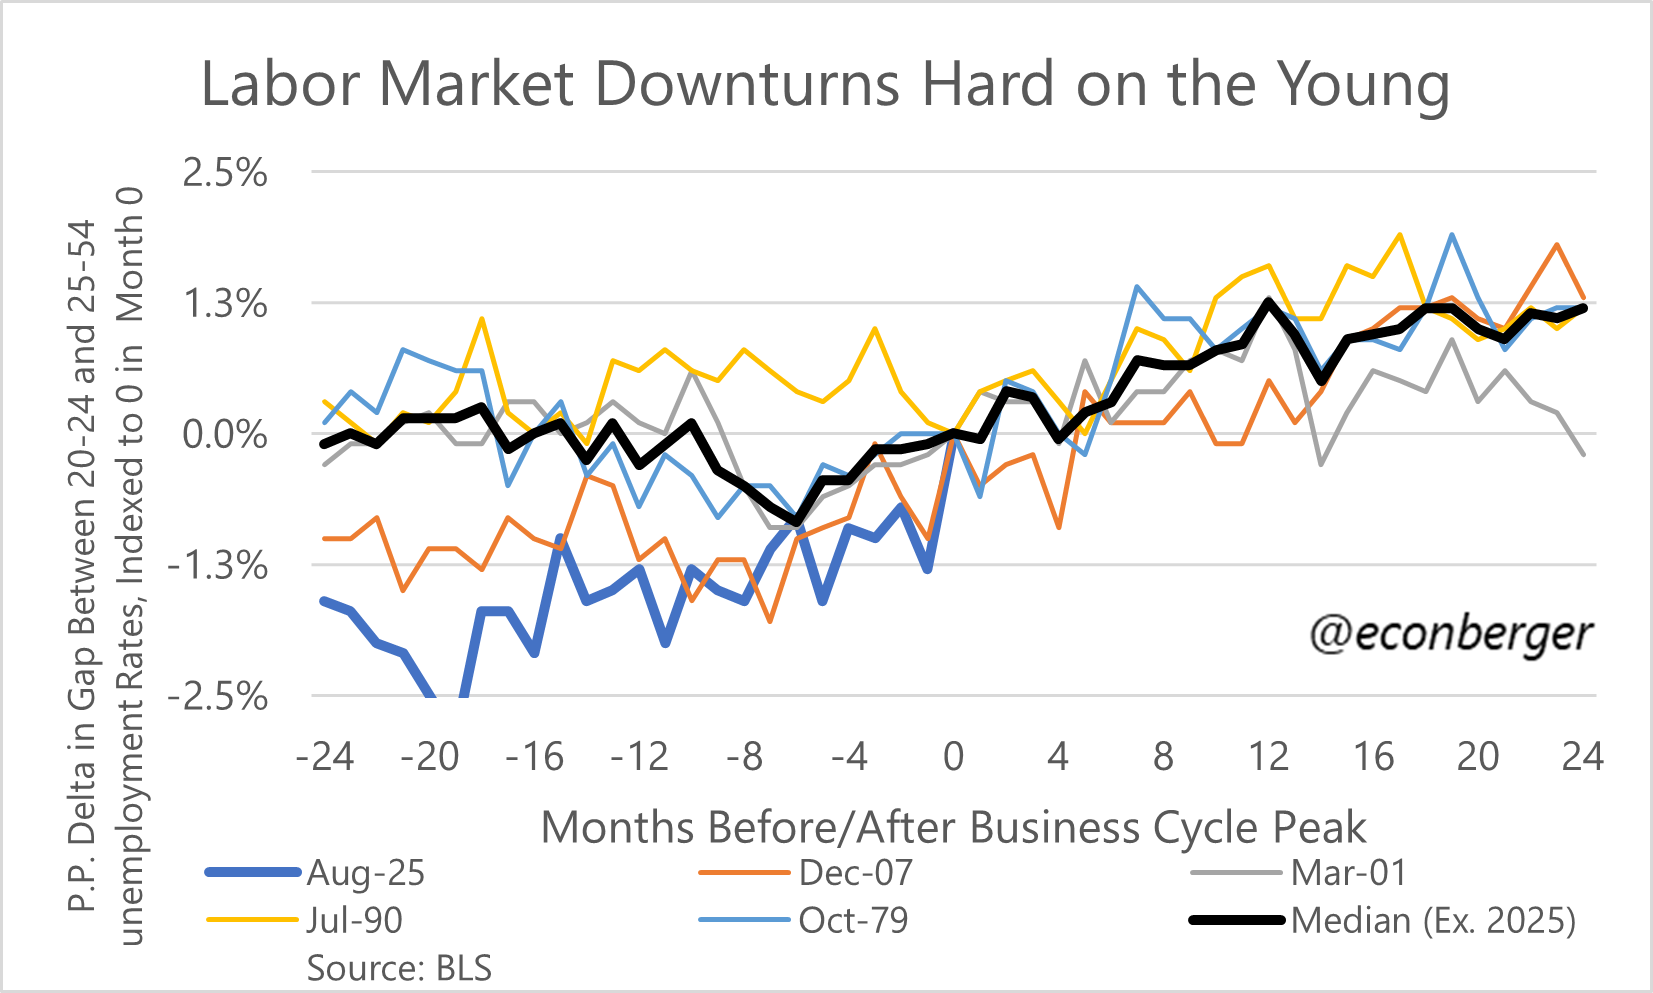
This youngster-exposure to hiring slowdowns during non-recessionary labor market cooling is unfortunately normal. If you want to take it a step further than I am currently willing, non-recessionary coolings in the labor market tend to become pre-recessionary coolings.2
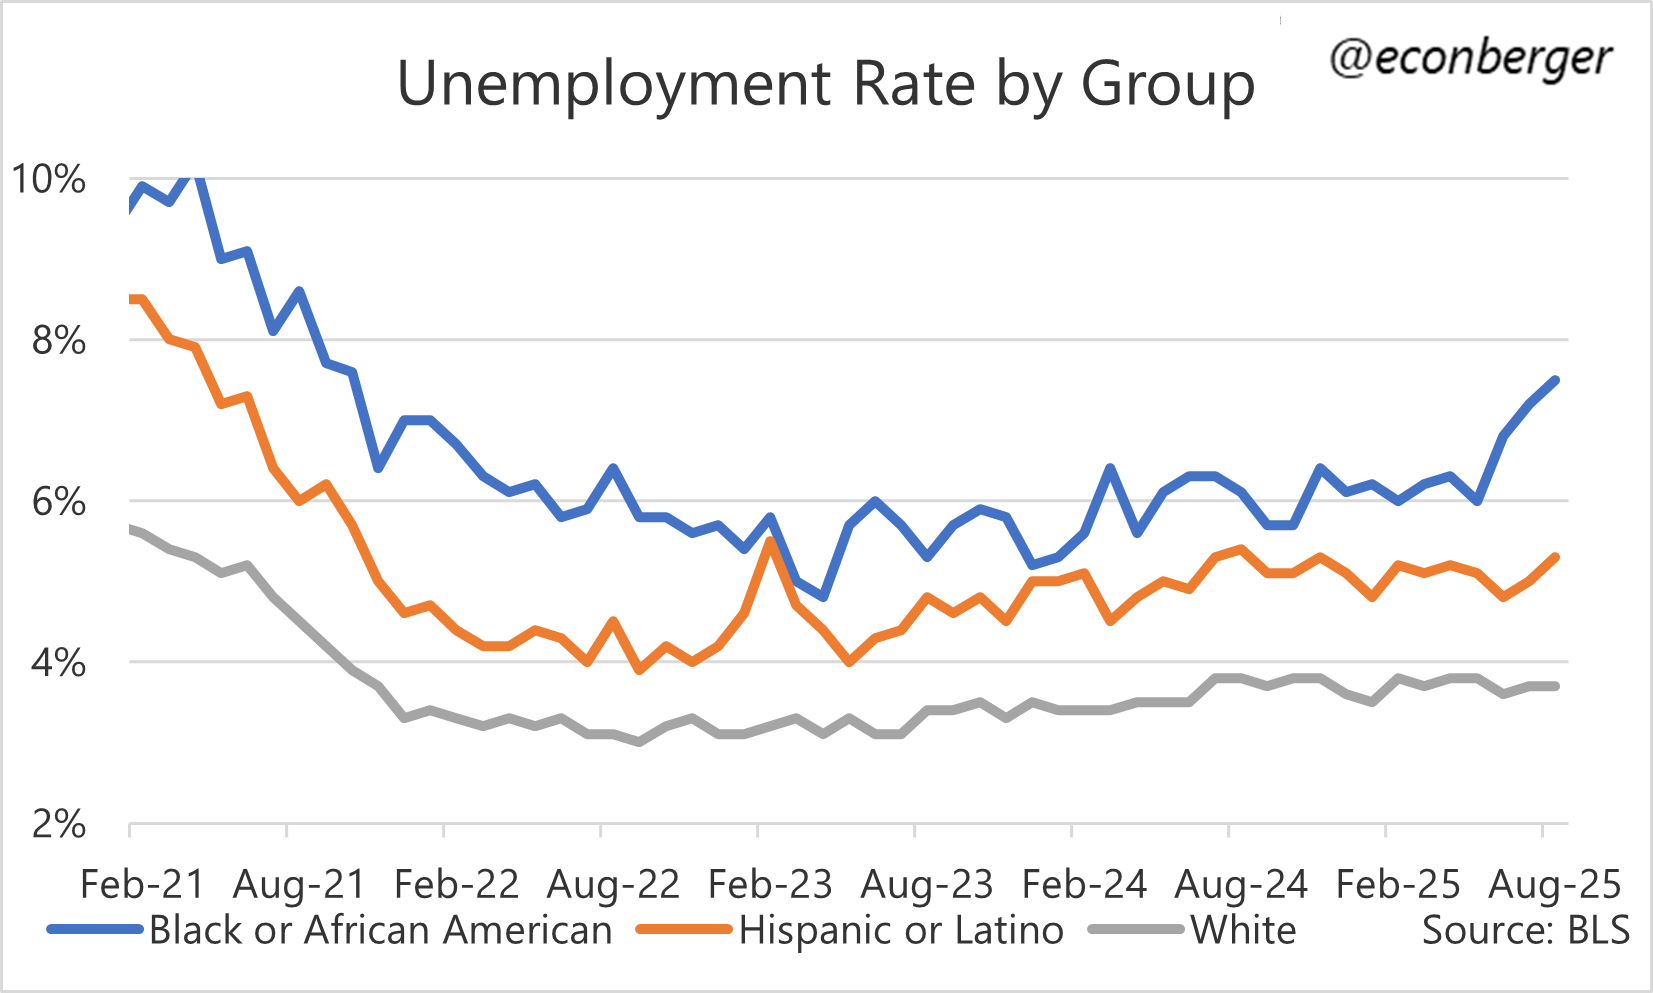
We also have some unpleasant news on African American unemployment, which rose to its highest level since the fall of 2021 even as unemployment of white and Hispanic Americans holds steady.
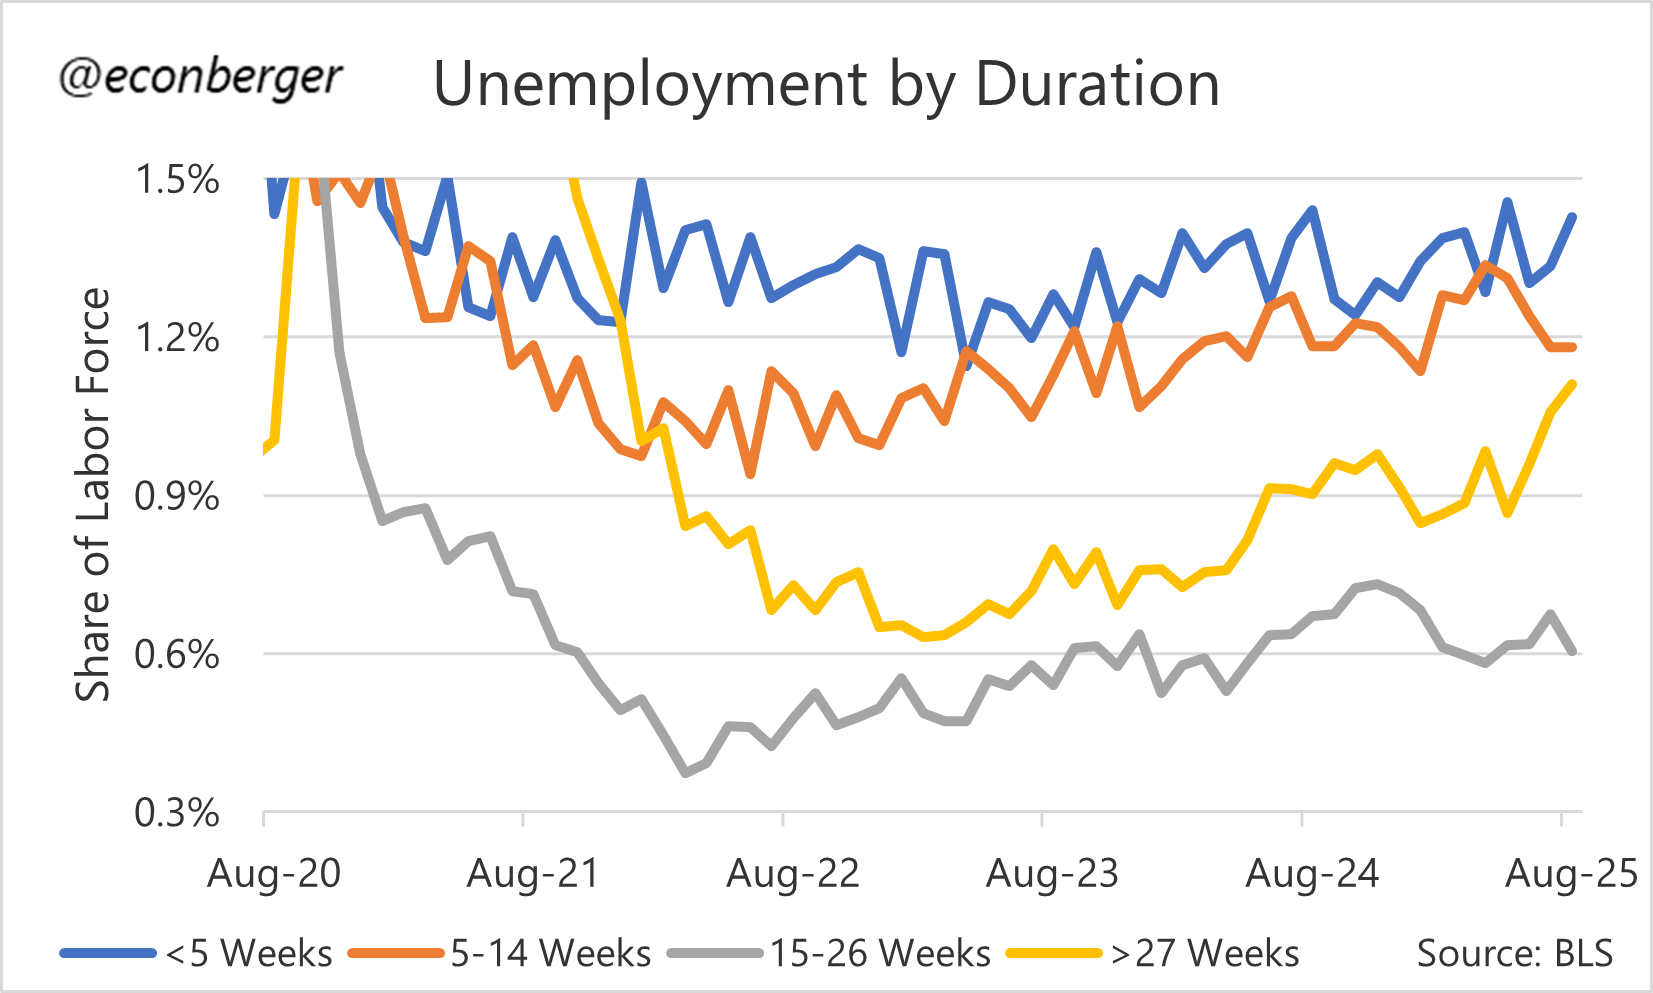
Another manifestation of the hiring slowdown is in long-term unemployment, which has risen sharply. There aren’t a lot of people who fall into unemployed status, but those that do are spending more and more time stuck there without finding a job.
4. A Youth Unemployment Crisis, Not a College Grad Unemployment Crisis
I’ve written about this a lot in 2025, but it’s important to reiterate. If you consume high-quality media, you’ve probably heard a lot about what a tough time recent college grads are having. And it’s true, their unemployment rate is back to 2015 levels.
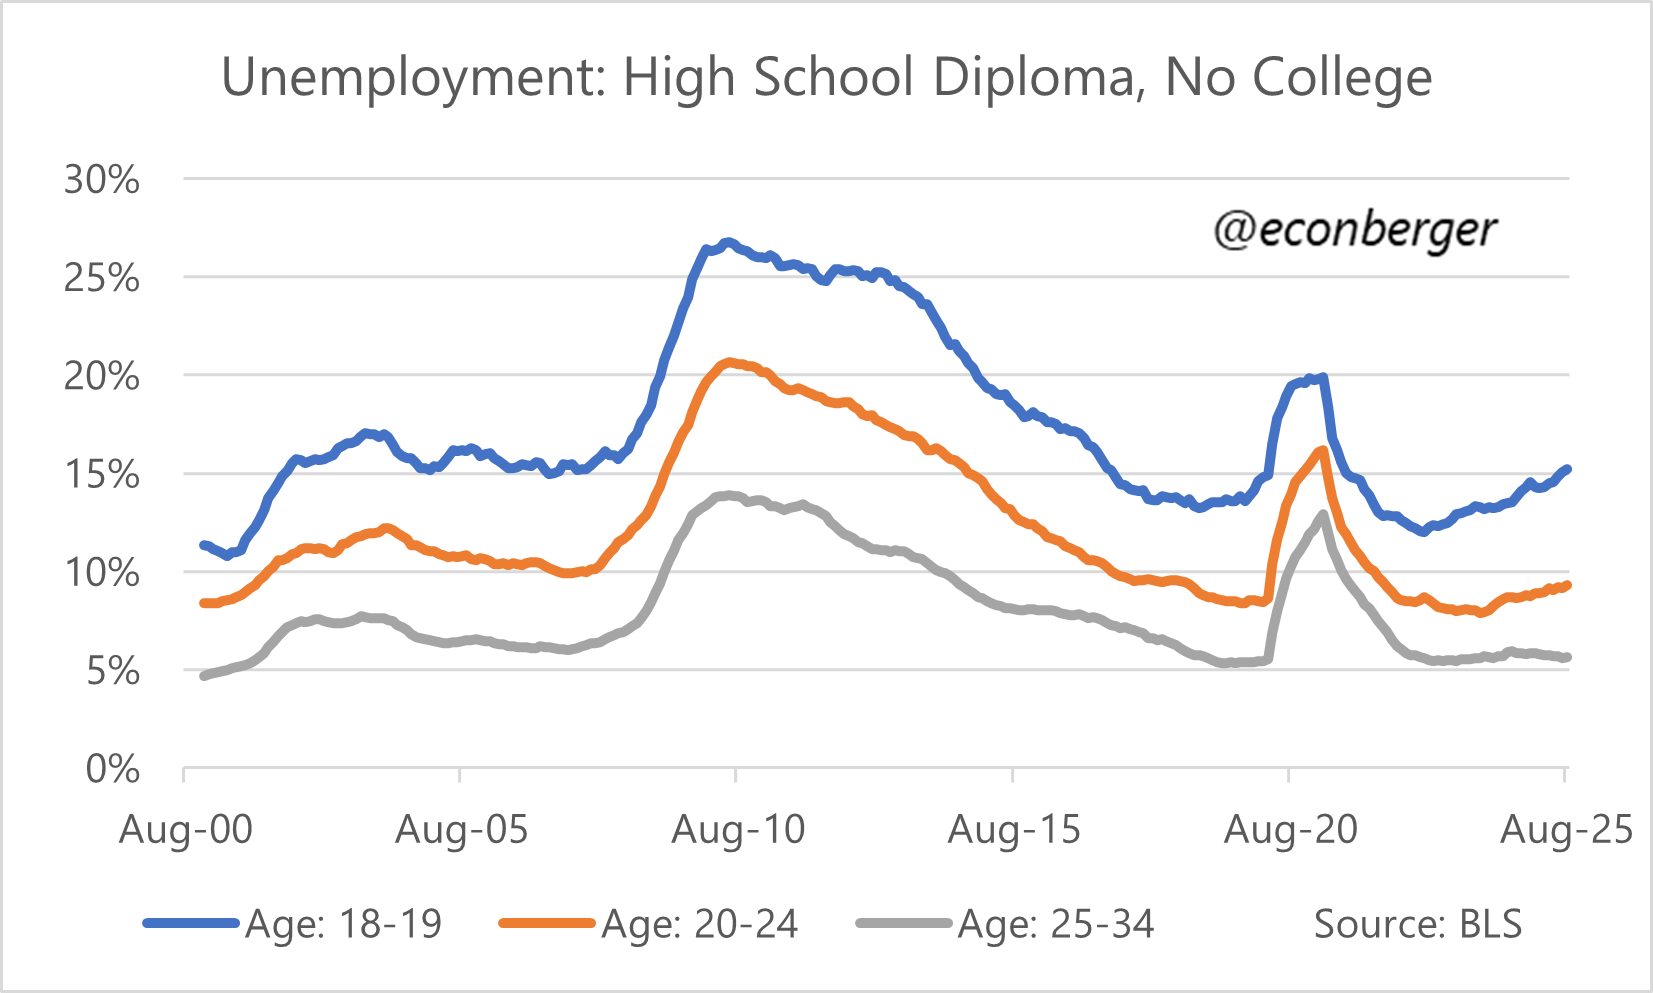
But unfortunately, weak hiring means that unemployment is rising for other young people too, even if they don’t have a 4-year degree. For example, the unemployment rate for high school grads in their late teens has averaged 15.2% in the past year, comparable to early 2017. It’s risen by 3 full percentage points since early 2023.
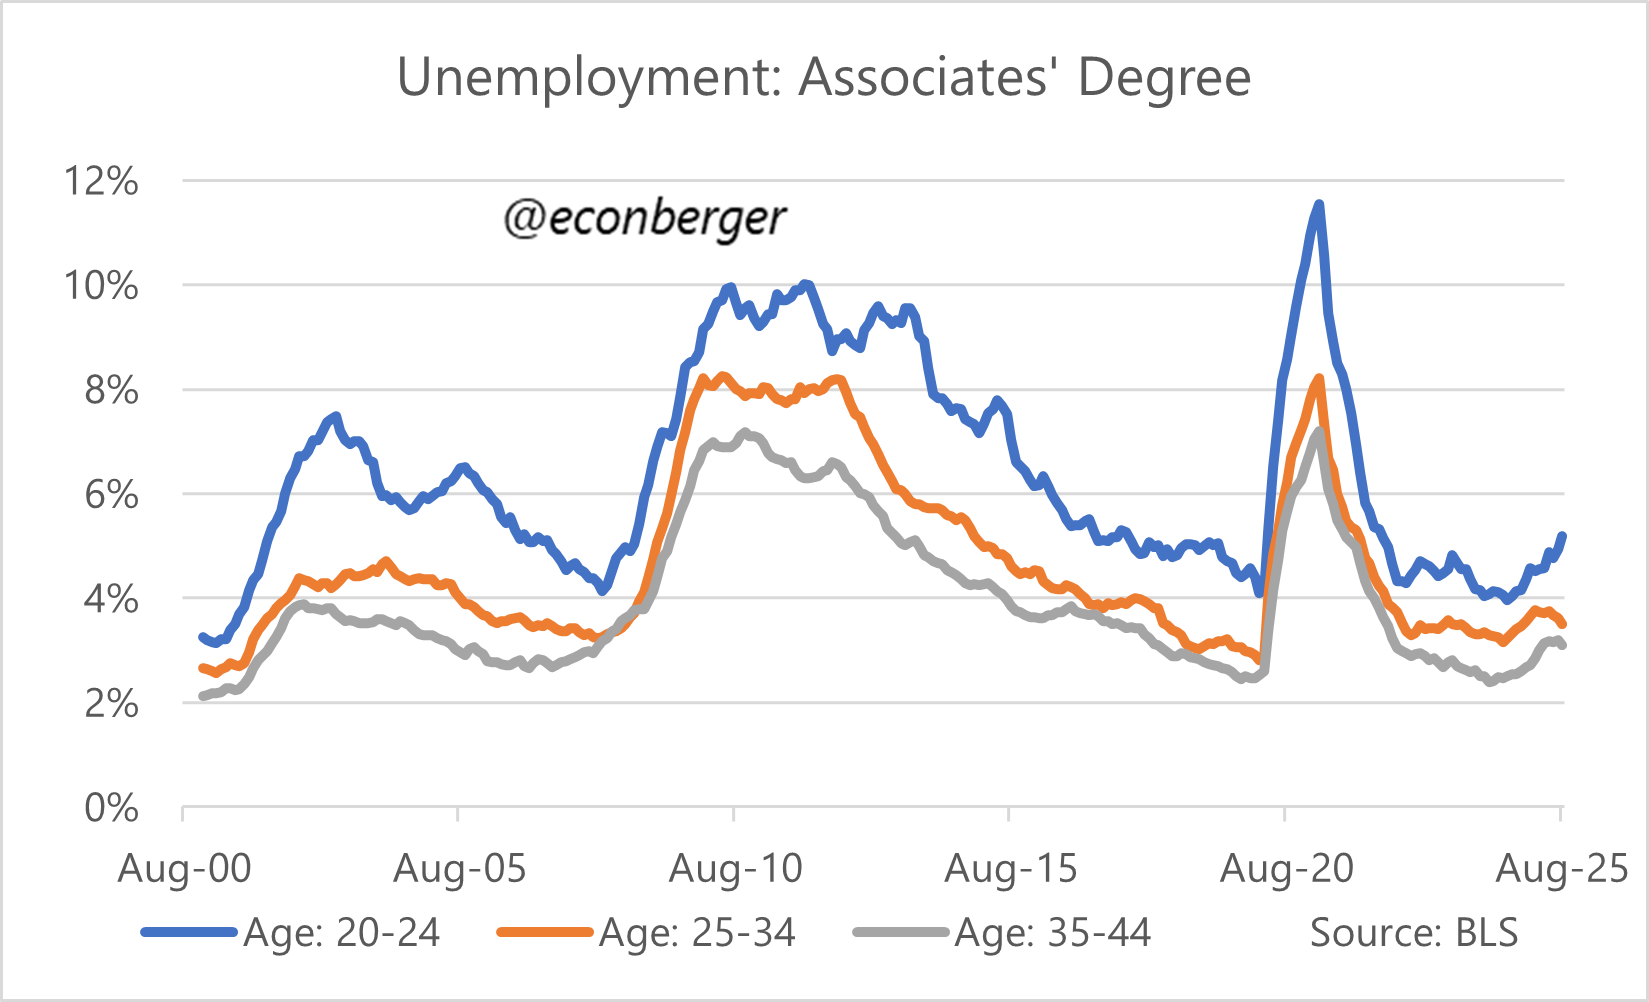
And holders of associate degrees in their early 20s - for a while, a particularly robust corner of the labor market - are also getting hammered. Over the past year, their unemployment rate has averaged 5.2% - it’s risen by more than a percentage point in just one year.
Ironically, one segment that is not worsening rapidly at present is the one that started this entire discourse: young college grads. Their unemployment rate is quite elevated by historical standards but stopped going up earlier this year. I wouldn’t bet on it holding steady if the job market keeps worsening, and it’s thin gruel to characterize anything as “bad but not getting worse” - but as I keep saying, don’t ignore struggling non-BA youngsters.

5. A Reminder About Next Week’s Benchmark Revision
On Tuesday September 9th, the BLS will release the preliminary estimate of its benchmark revision. It will probably be large and negative. On Sunday I’ll be sending a full post on the topic, mostly reiterating stuff I have already written. If you can’t wait until then, you can ready what I wrote here and here.
Especially since weak labor supply growth implies lower potential GDP growth, even without our labor demand problems. You’d need productivity growth to pick up a lot of slack.
I don’t see any reason why we can’t go up another 0.5-0.6 percentage points in the unemployment rate without a recession. But of course a full-blown downturn is possible.