

BLS Jobs Report Preview (August)
BLS Jobs Report Preview (August)
Slow Cooling to Continue

TL;DR: The US job market is in OK shape, but trending in the wrong direction. Forecasters expect that Friday’s jobs report will show a decent employment gain and a slight decline in the unemployment rate, but no change to the underlying dynamics of ongoing cooling.
In the rest of this preview, I cover:
The Big Picture
The Composition of Unemployment
Recap of the Preliminary Benchmark Revision
What About “Revisions” to the Household Survey?
1. The Big Picture
The job market can no longer be characterized as “hot” or “great”; “lukewarm” or “ok” are more accurate, with most indicators indicating an ongoing cooling. The good news is that this cooling is still gradual rather than sudden; the bad news is that unless these trends are stopped soon, we’ll eventually have to downgrade our terminology further to “soft” or “weak”. And if/when that happens, “we avoided a recession” will be meager consolation.
In case that reads as extremely downbeat, let me caveat with: help from monetary policy is on the way. The Fed is going to ease policy, and as long as inflation continues to play ball, will eventually cap labor market cooling. Hopefully that happens sooner rather than later.
My read on recent data:
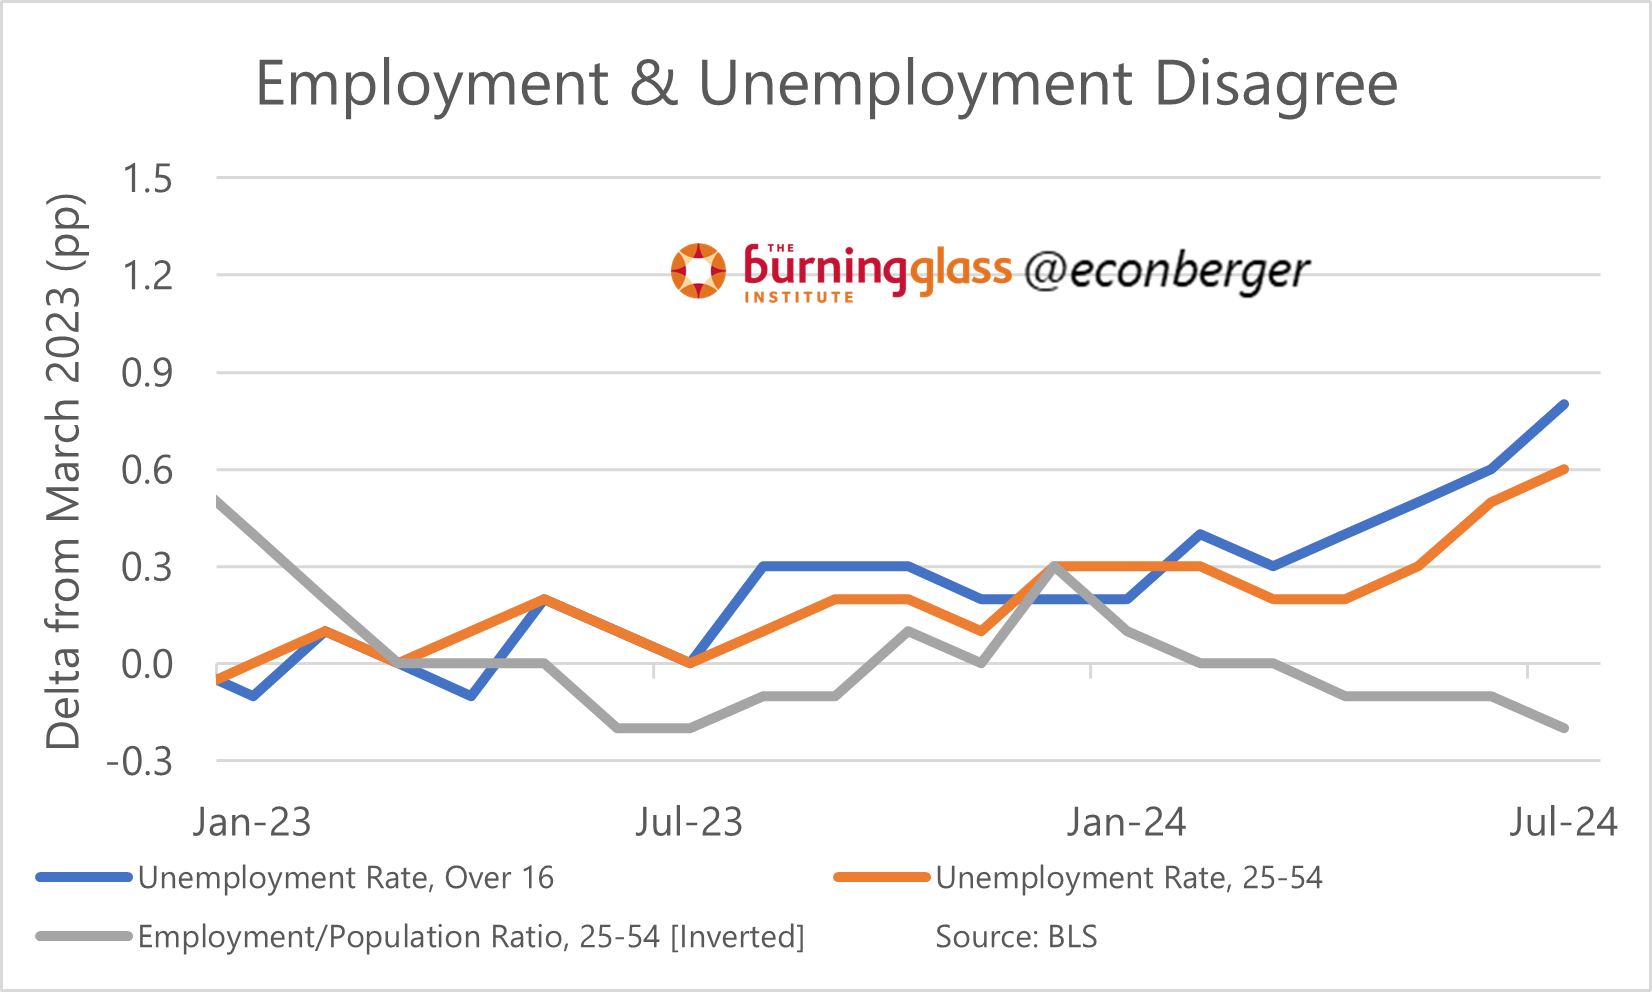
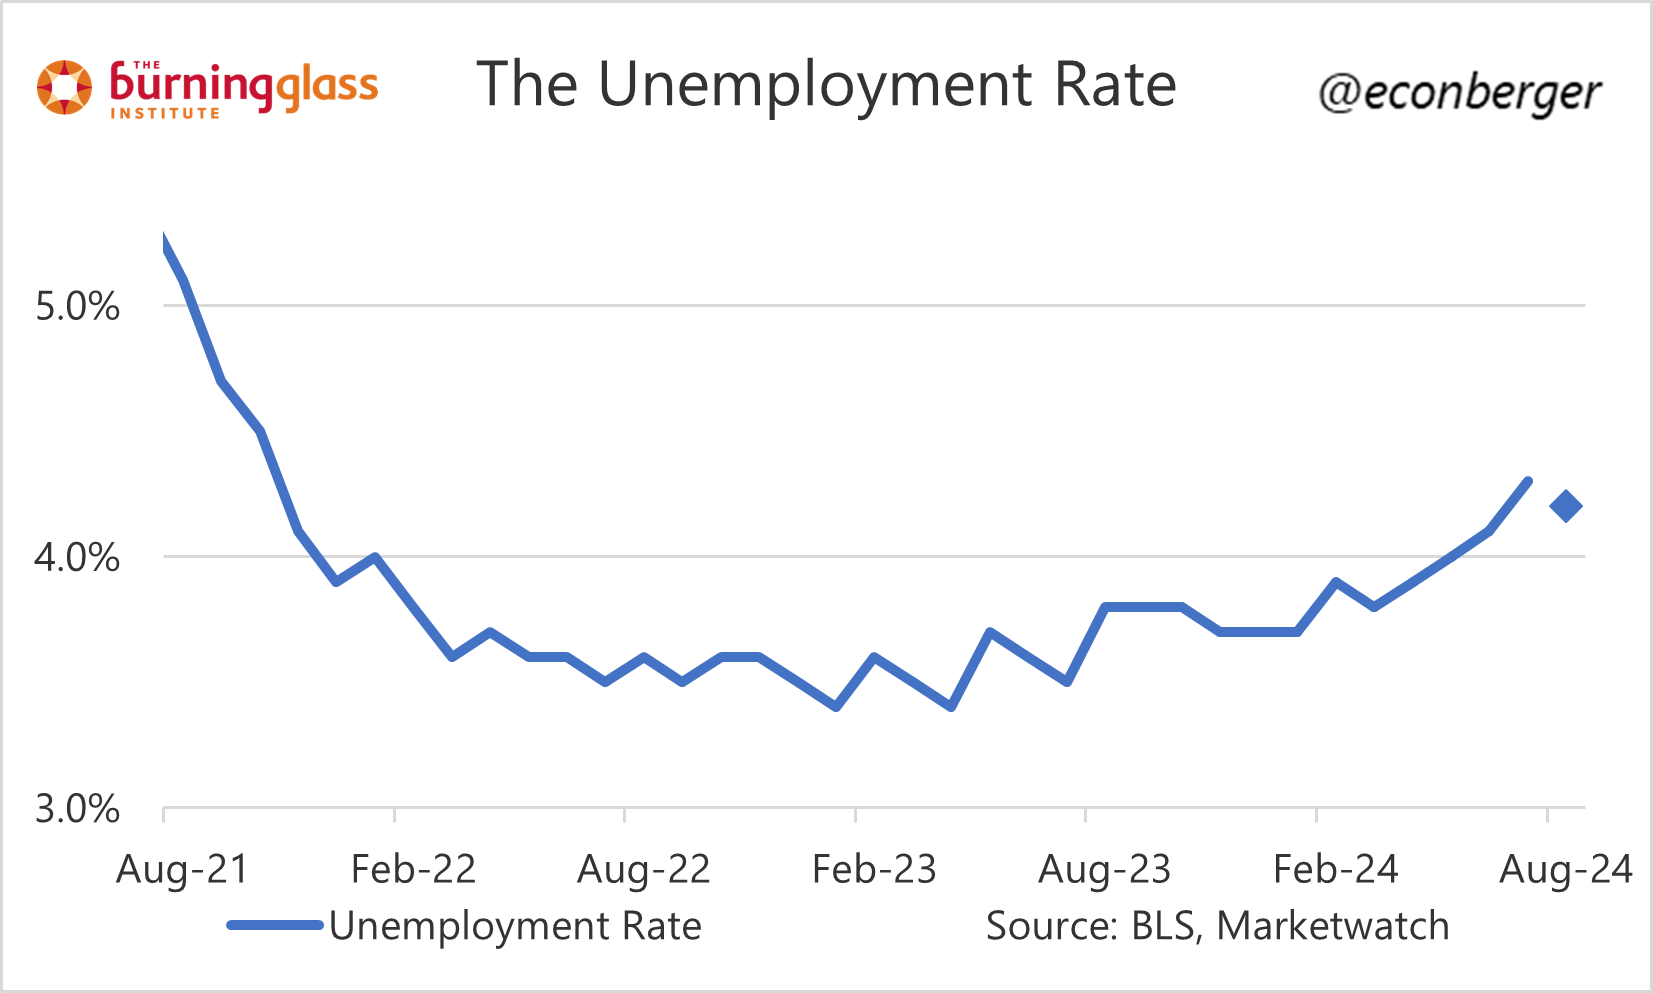
On the more pessimistic side, the unemployment rate has gone up by about 0.8 percentage points from its spring 2023 trough. Most of the increase has occurred in the past 6 months, and there was a particularly large jump (about 0.2 percentage points) in July.
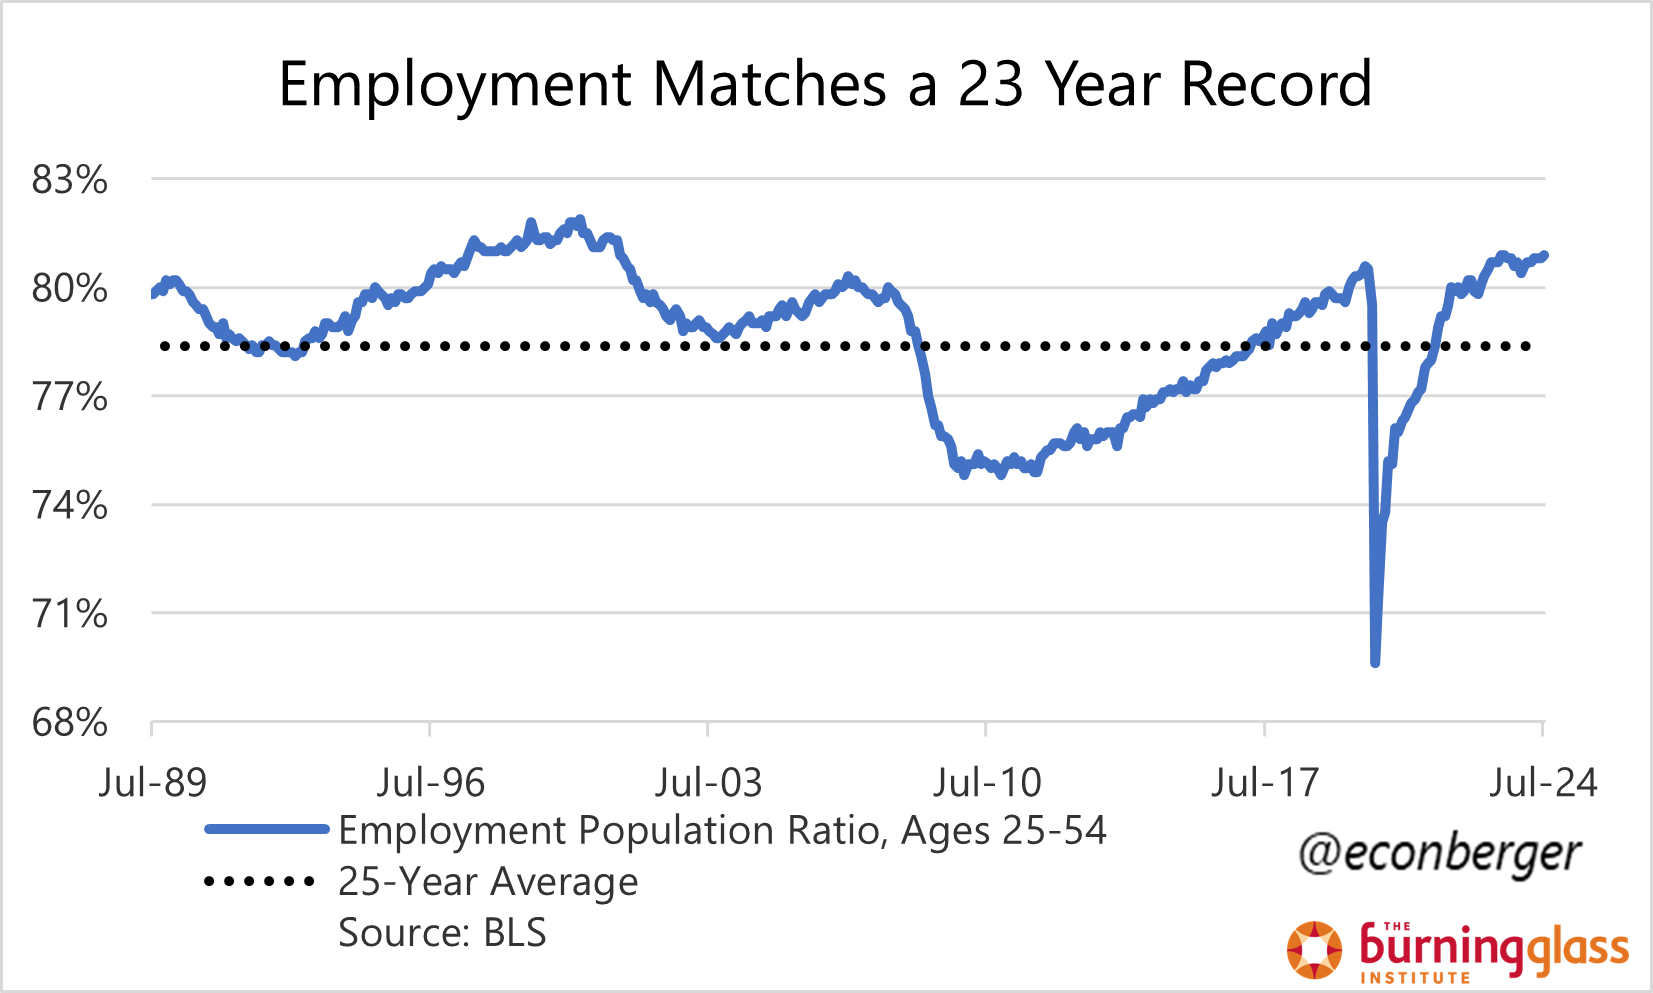
On the more optimistic side, the share of prime working age Americans was 80.9% in July, matching its highest level since 2001. This indicator has shown no signs of deterioration, though it has stopped improving.
In the middle:
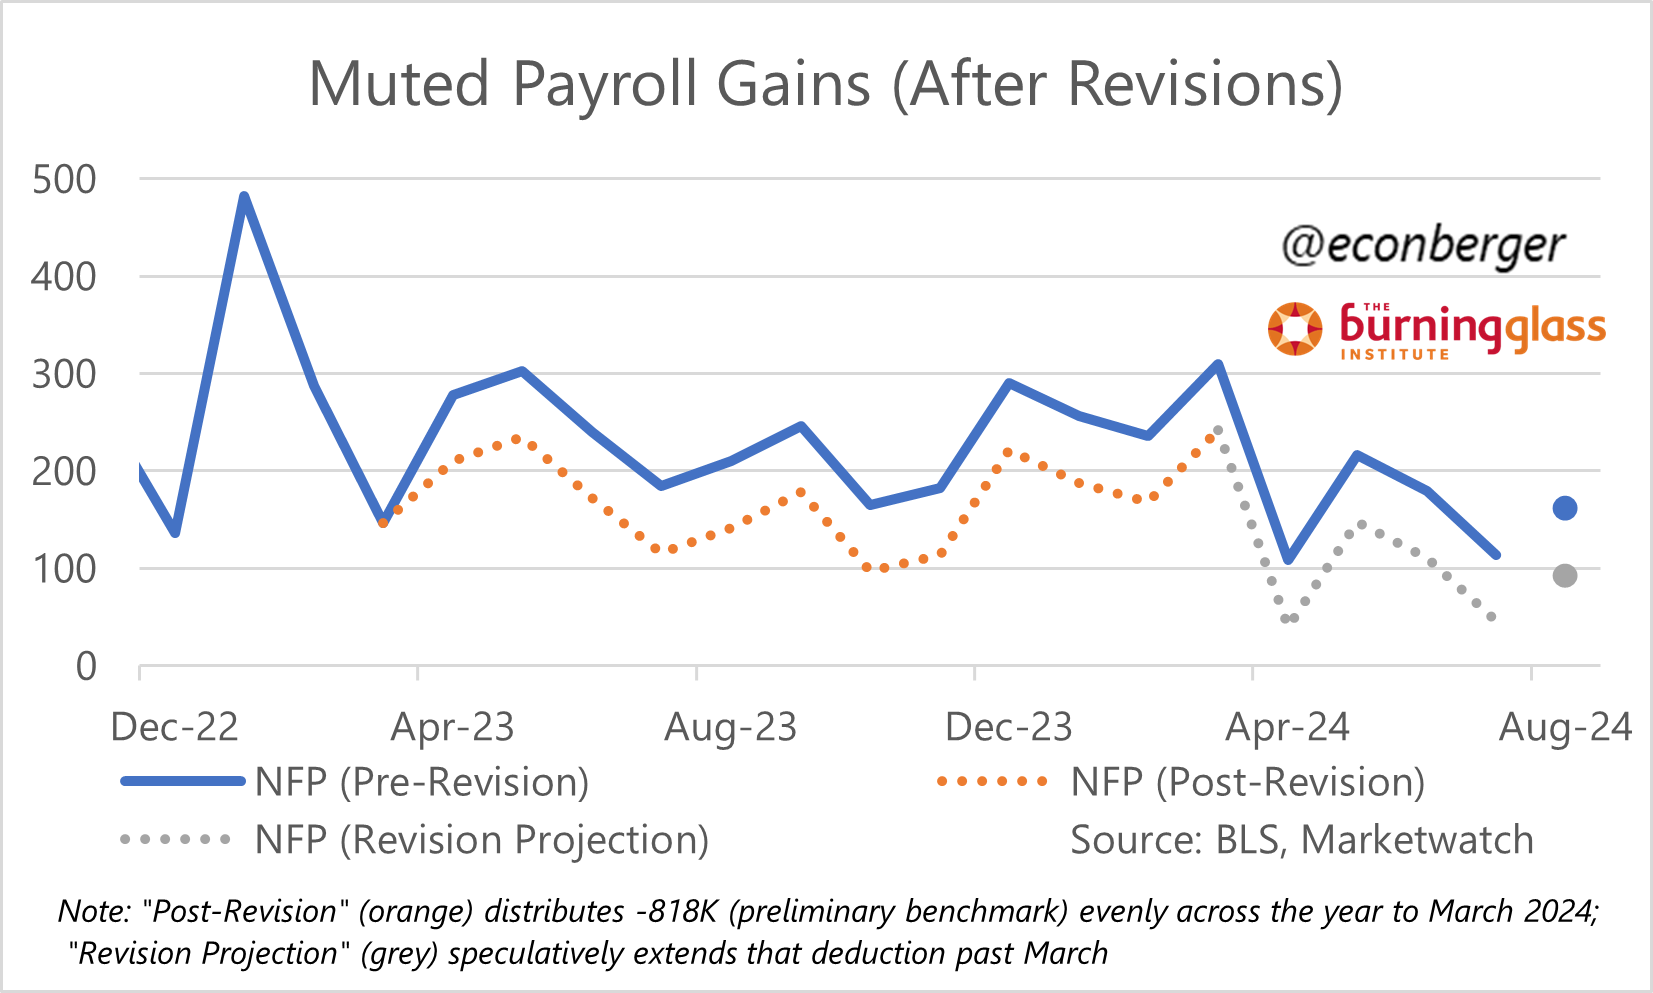
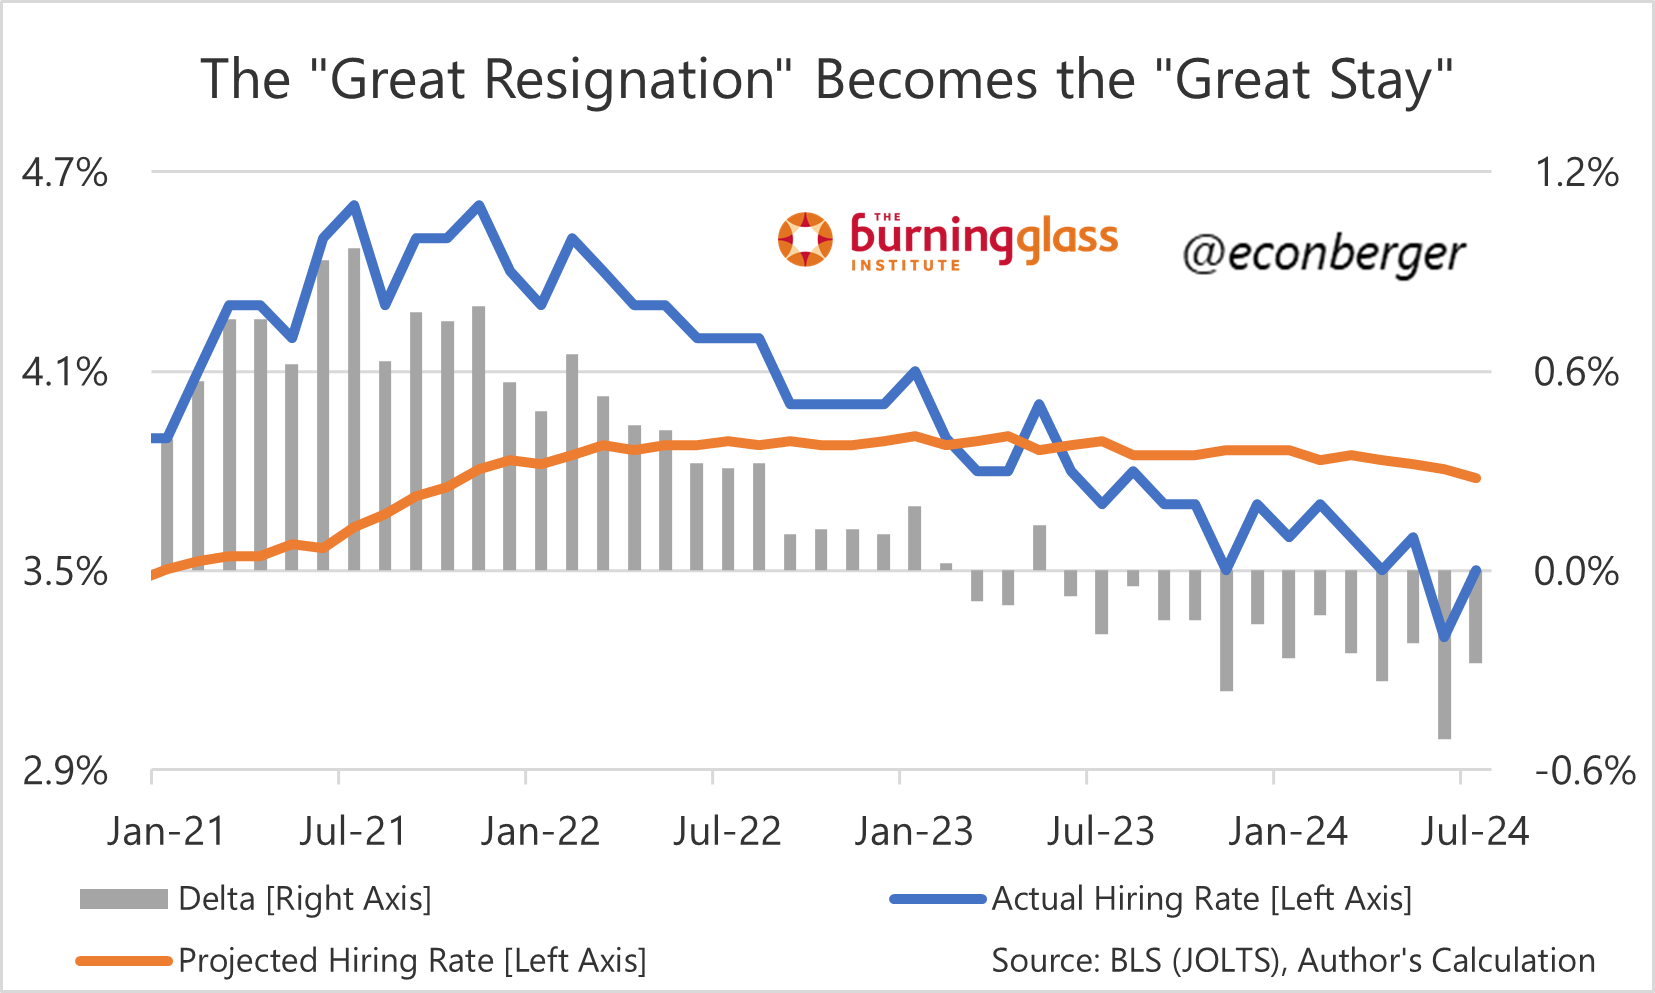
Nonfarm payroll employment has moderated recently, and (taking possible future revisions into account) has been growing at a fairly anemic rate.
Hiring and quits from the JOLTS report continue to trend downward.
Forecasters expect a decent August gain in non-farm payroll employment (though, as stated above, it is a good idea to consider possible future negative revisions). And the unemployment rate’s July jump is expected to partly reverse. Both of these outcomes would be consistent with the assessment above.
2. The Composition of Unemployment
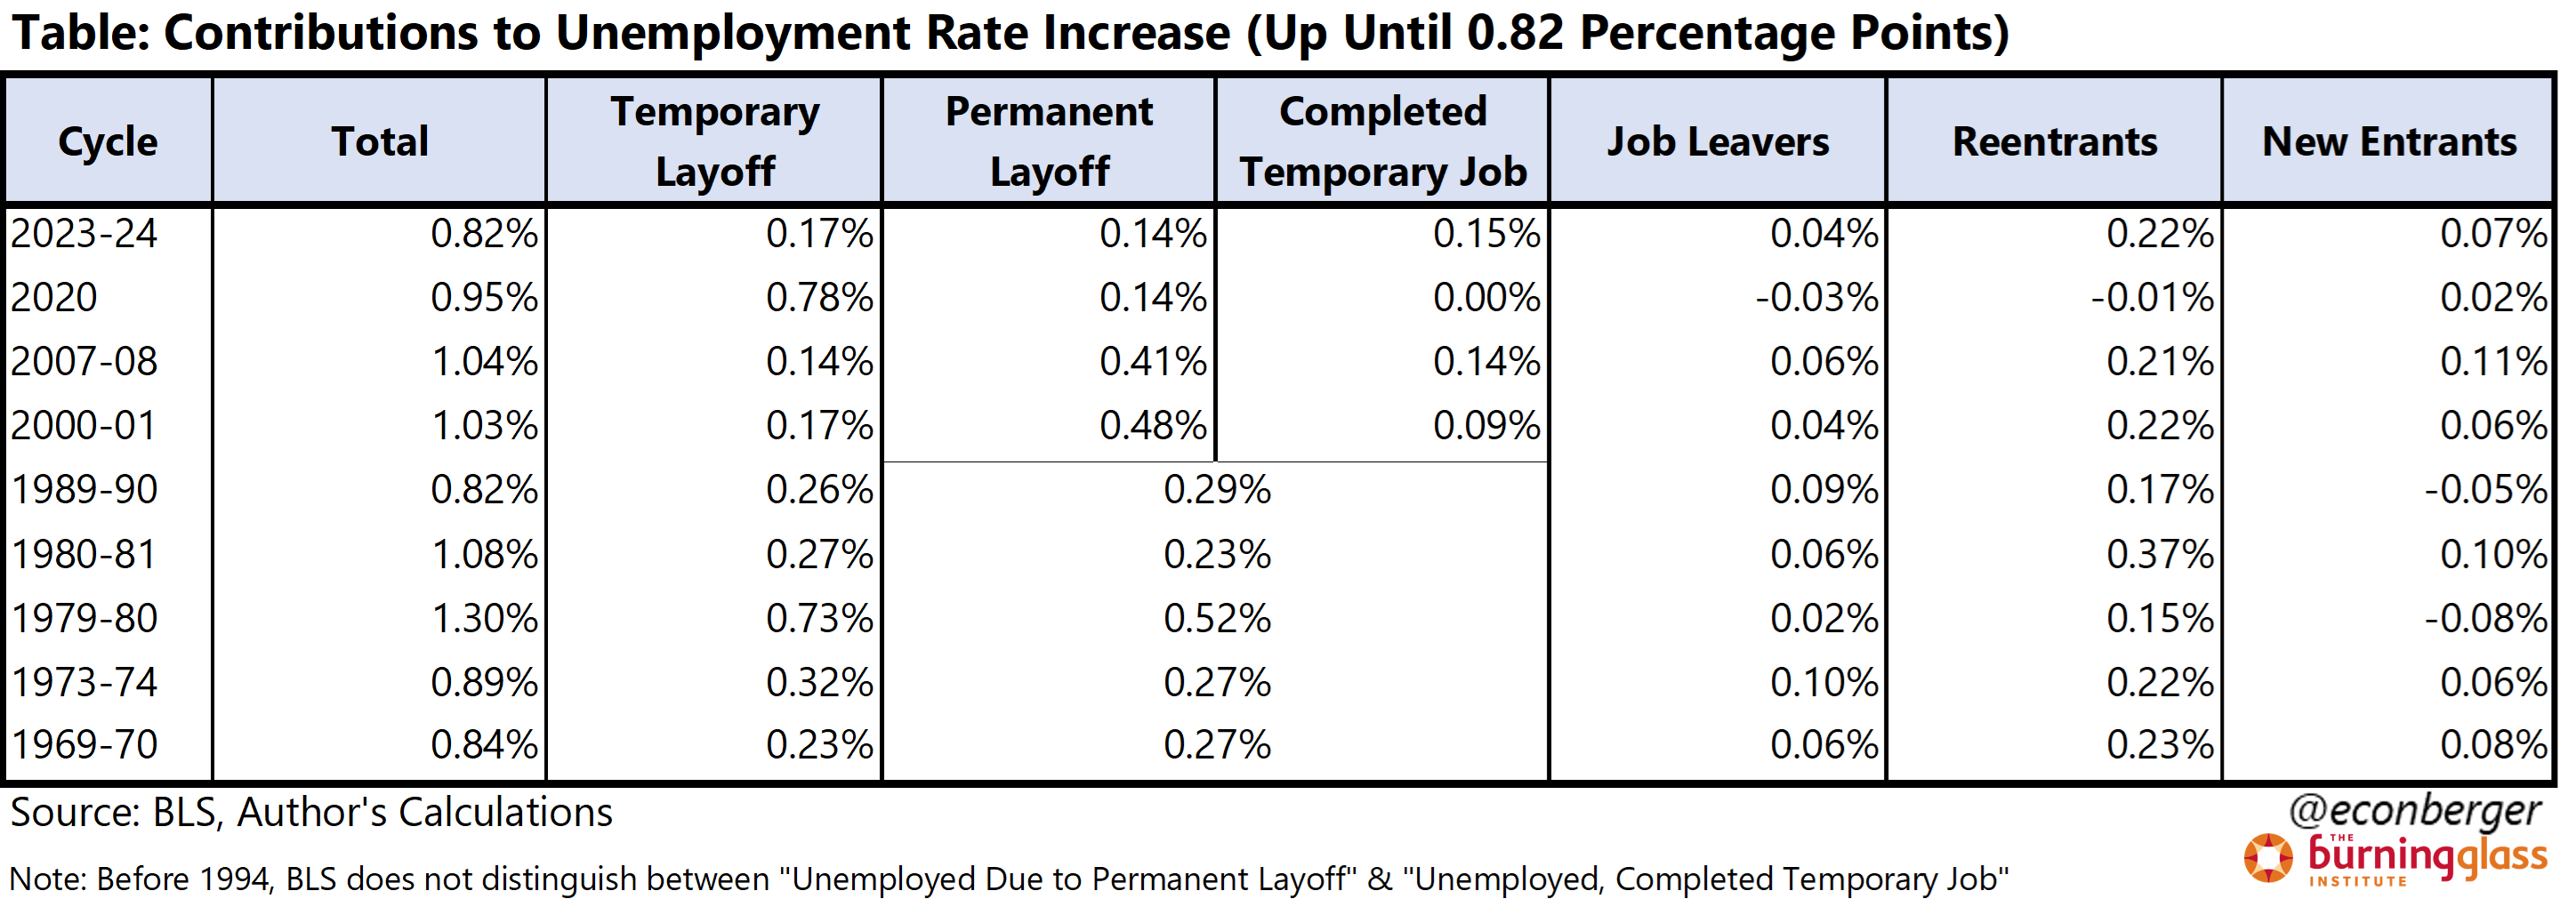
The composition of recent increases in the unemployment rate has been surprising, and partly reassuring. Much of the increase has come from labor force entry: new entrants and re-entrants. In addition, July’s large jump was driven almost entirely by a surge in temporary layoffs (people who expect their employer will recall them to work). And unemployment due to permanent layoff has been flat since the beginning of the year (though it did go up a little between the fall of 2022 and the beginning of 2024).
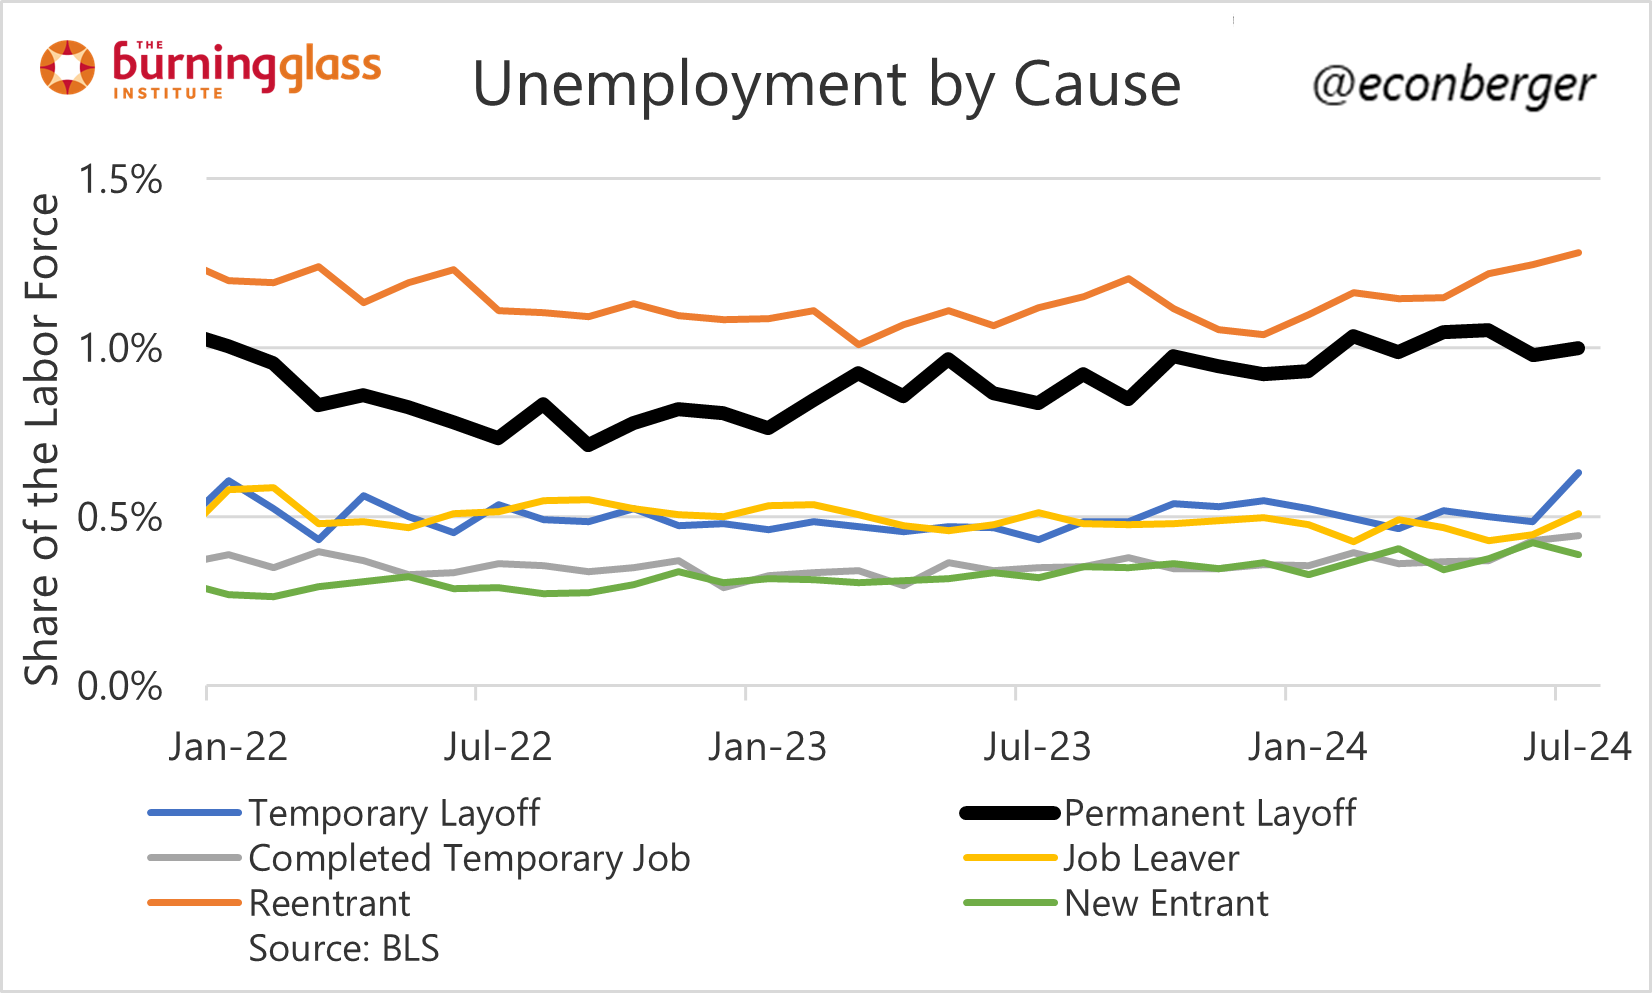
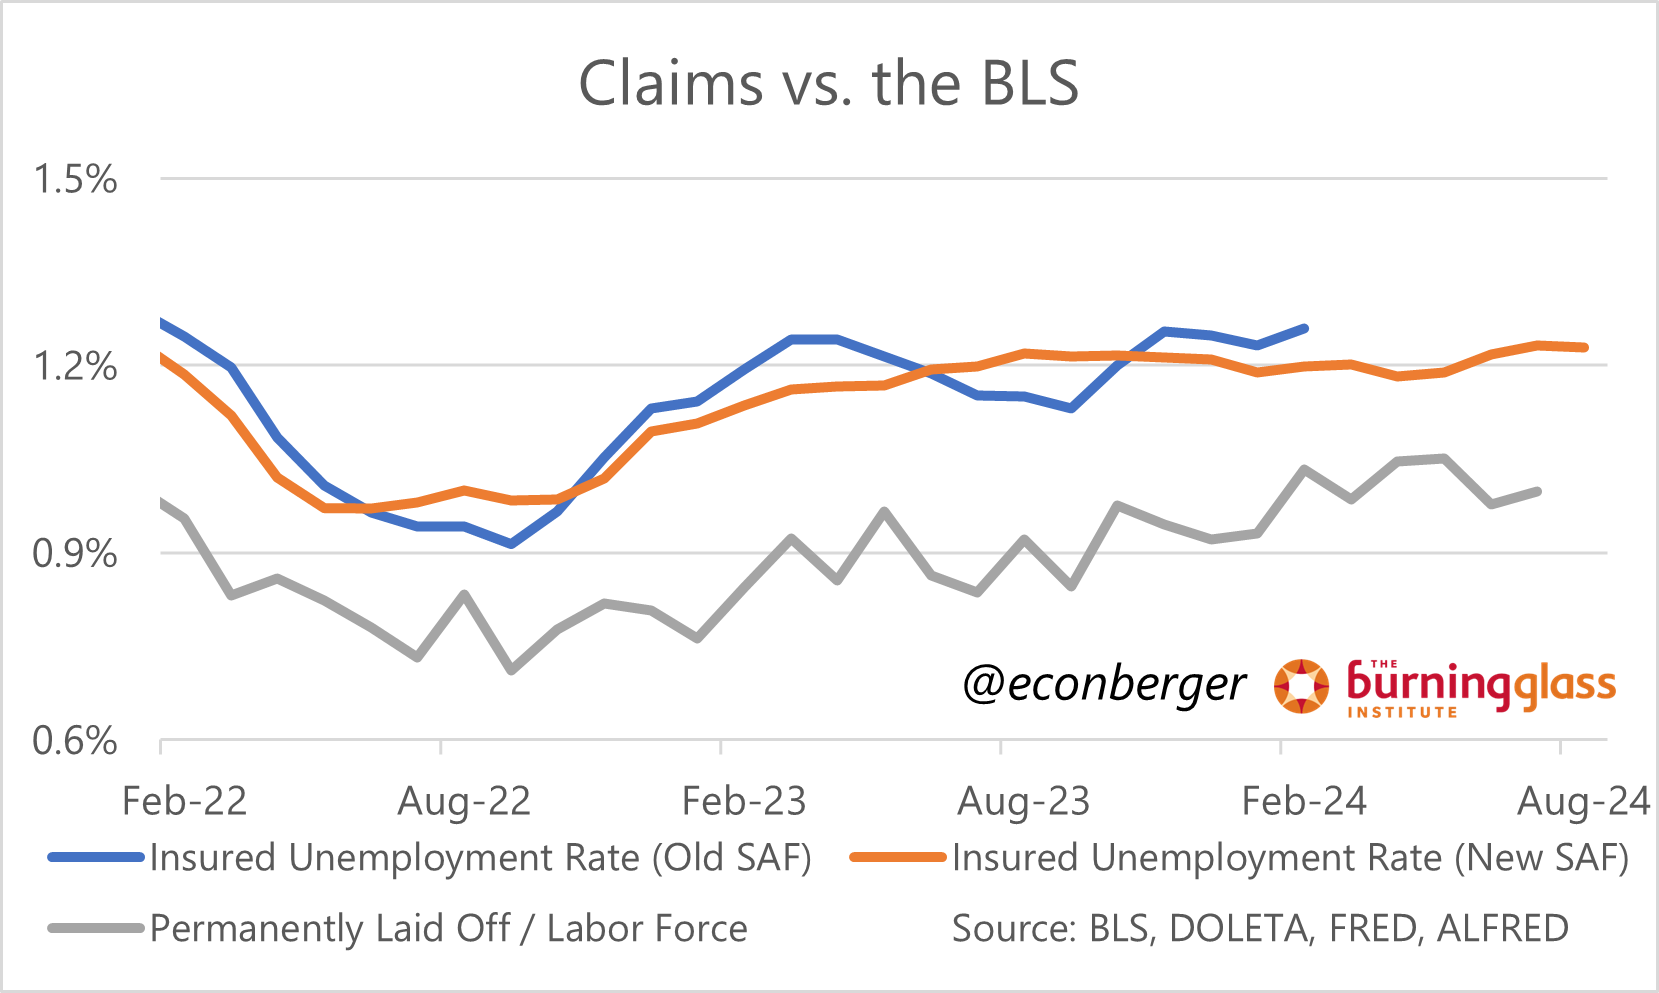
This isn’t the kind of mix that we typically associate with recessions. Setting aside the COVID downturn (which was quite anomalous), the two most recent labor market recessions (2000-03 and 2007-09) were dominated by an increase in unemployment due to permanent layoff (half or more of the total increase). The fact that it has not gone up over the past 5 months mitigates (but does not eliminate) my worry about the overall increase in unemployment. Its ascent could resume, of course, but the recent flatness of continuing claims is consistent with at most a minimal increase in August.
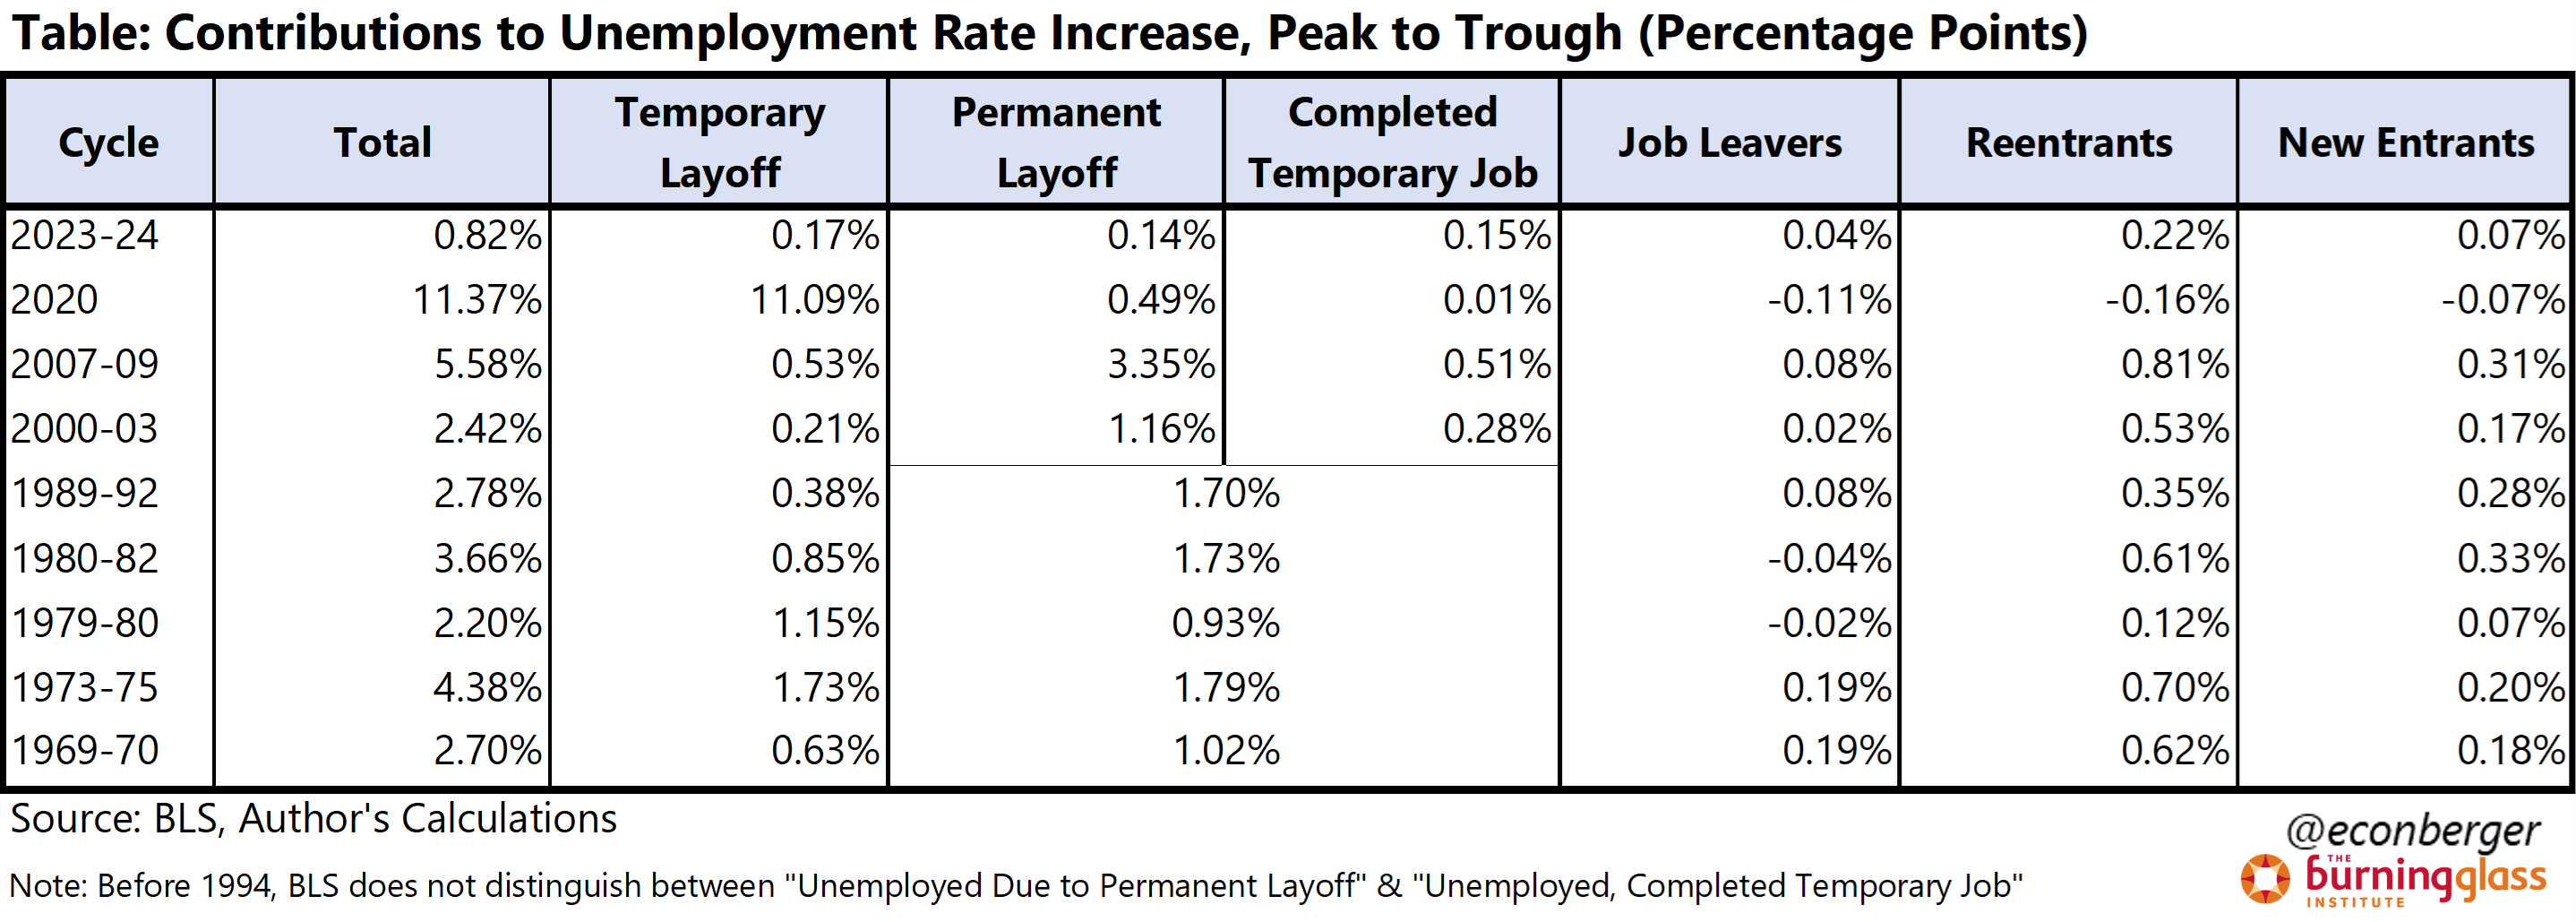
In both the 2000-03 and 2007-09 cycles, the 2nd biggest contribution to unemployment’s rise came from re-entrants - presumably, people who stopped and then resumed job search. This casts a more downbeat light on the recent increase in re-entrants: some may be former “unemployed due to permanent layoff”. The good news is that, unless more people lose their jobs, this kind of “bad re-entry” has only limited room to grow.
And finally, unemployment from temporary layoff - people who have lost their job, but expect to regain it - has played only a minor role in post-1980 recessions.1 This was the oddest feature of the July jump in the unemployment rate, and one I anticipate will reverse in August. (Though it is also the case that Hurricane Beryl, initially suggested as the culprit, was not to blame.)
A common saw is that “temporary layoffs turn into permanent ones”. It’s certainly possible in a micro sense (specific employers, etc) this is sometimes true, but it’s not apparent in the aggregate data. The role of temporary layoffs early in the 2007-09 and 2000-03 downturns was only slightly larger early on than it would be for the downturn as a whole.
The degree to which this relatively benign, reassuring mix sticks going forward is unclear. I wouldn’t bet on it. If hiring keeps sliding, it seems more likely than not that unemployment due to permanent layoff will gradually creep up going forward - even if a recession never comes.
3. Recap of the Preliminary Benchmark Revision
The BLS published their preliminary estimate for the benchmark revision they will implement early next year: -818,000. This revision will apply to the level of nonfarm payroll employment as of March 2024, and will also impact monthly data in the year leading up to that point.2
The current, pre-benchmark count for employment growth in the year to March 2024 is 242,000 per month; the revision slices off 68,000 per month, landing us at 174,000 per month. This is not a bad number by any means - if 242,000 is “strong”, then 174,000 is “solid”.
An obvious question is: what about more recent data? And though it’s not scientific, my inclination is to assume that is due for large downward revisions too. (We’ll know in early 2025.) For what it’s worth, that would leave August’s “solid” anticipated161,000 increase around a much more muted 100,000.
And the reality is this doesn’t matter much to our understanding of the labor market, because of what we know about the household survey. The aforementioned rise in the unemployment rate, as well as lower-profile data like part time work for economic reasons, indicates that the labor market has cooled substantially and continues to gradually cool. Whether nonfarm payroll growth is at 300,000 or 30,000 per month doesn’t change that conclusion.3
4. What About Revisions to the Household Survey?
The household survey - where the unemployment rate, labor force participation ratio, and employment population ratio - is untouched by the benchmark revision exercise that lopped off so many nonfarm payroll employment jobs. And the good news is if you’re using the data properly - by relying on household survey ratios, rather than absolute counts - you don’t need to worry about household survey revisions at all.
The household survey is subject to two types of “revisions” (quotation marks intentional), one minor and one significant. The minor one is revision to seasonal adjustment factors; this happens every year, and causes only minor wiggles in the historical data.
The significant "revision" to the household survey comes from Census Bureau population estimates. All the data in the household survey - employment, unemployment, etc - is anchored to those estimates. So if population counts are wrong, employment & unemployment counts are too.
The Census population estimates are updated once a year, and those updates are then fed through to the household survey data in early February each year.4 Historical data are not revised (that’s why I put “revision” in quotes earlier) - it's just that going forward the household survey data are based on the new estimates. For seasoned observers, this causes discontinuous jumps/declines in data series like population, employment and unemployment.
This is particularly relevant right now because there's strong evidence that the Census population estimates are experiencing a massive undercount - possibly as much as 3 million. Most but not all of this is due to immigration. Consequently, we’re also undercounting a bunch of other data, including employment and unemployment.
This means that analysis based on household survey counts is severely flawed. In absolute terms, unemployment has gone up by more than current data has indicated. And so has the household survey estimate of employment levels. Indeed, it is likely that the employment undercount in the household survey is larger than the employment overcount in the establishment survey.
The ratios, on the other hand, should be relatively untouched - because undercounts affect both the numerator and denominator. There may be some small changes; the ratios in the report are weighted average of “primitive ratios” for small sub-populations, and new population estimates can change the weights. But our perception of the labor market - gradually rising unemployment rate, flat prime-working-age employment-population ratio - will not change.
Pre-1980, temporary layoffs played a much more important role in downturns. A factory or construction site would shut down when demand was slack, then reopen with the same re-employed workers when demand picked up. In addition, Dean Baker points out that union contracts required the recall of laid off workers. But the US economy has changed a lot since then.
The revision will also have an impact on hours and pay growth, but those will be small.
This is also why the debate about undocumented workers’ possibly differing status in the CES and QCEW is mostly of academic interest.
There’s a possibility that these population undercounts will not be fully corrected until the 2030 Decennial Census.
The labor mkt is not ok anymore.
Here is my article analyzing whether the economy is already in a recession:
https://arkominaresearch.substack.com/p/is-us-economy-in-recession?r=1r1n6n
Assuming state-to-state movement from high unemployment states (eg CA) to low unemployment states (eg FL) is it possible that responses in the former are being over weighted and the latter under weighted (i.e. biasing headline towards worse employment picture)? If so, could adding updated population data fix this?