
"Soft Data vs. Hard Data": Less Than Meets the Eye
They disagree less than you think

TL;DR: The supposed divergence between “soft data” and “hard data” in their assessment of the US economy is mostly illusory:
The divergence is mostly between different segments of soft data
Soft data that measure concrete aspects of the current economy are corresponding reasonably closely to the hard data.
Table of contents:
Conventional wisdom: divergence Between “soft data” and “hard data”
What are “soft data” and “hard data”?
Why the supposed disagreement is mostly illusory
Conclusion
More below chart.

1. Conventional Wisdom: Divergence Between “Soft Data” and “Hard Data”
If you’re a consumer of economic news, you’ve probably encountered a story highlighting the divergence between “soft data” and “hard data”. Supposedly, the two disagree, with the soft data indicating a rapid deterioration in the economy even as the hard data holds up fine.
Here’s a nice outline from the great Sam Ro (who has a substack!):
On one hand, the soft, sentiment-oriented data has been disappointing. The University of Michigan and the Conference Board's surveys of consumer confidence have turned sharply lower in recent months. The NFIB's Small Business Optimism index has tanked. Sentiment among CEOs and CFOs has turned south. Purchasing managers at manufacturing and services firms have also become increasingly cautious. And it's all because of the Trump administration's volatile position on tariffs — which most people agree are net negative for the economy.
On the other hand, the hard data, which reflects actual activity, has been strong. Retail sales hit a record high in March, and weekly card spending data suggest that strength has continued into April. Durable goods orders and shipments continue at elevated levels. Meanwhile, key labor market metrics including job creation, unemployment, and claims for unemployment insurance continue to trend at levels associated with economic expansion.
I think this seeming divergence is mostly illusory, which I’ll explain in the next section. But before I do that, a quick explainer on what “soft data” and “hard data” are.
2. What are “soft data” and “hard data”?
“Soft data” come from various sentiment and opinion surveys of US consumers, households and businesses. They’re collected by a mix of private sector entities and government bodies. Sometimes people call these “survey data” but I don’t like that moniker as a lot of the hard data are also collected via survey. The main distinction is that the soft data don’t measure economic activity in a quantitatively precise way.
“Hard data” come almost exclusively from the government. Some come from surveys, others from administrative data. Their key feature is quantitatively precise estimates of economic activity, in terms of counts, dollar values, or indices. How many people were hired last month, and how many hours did they work? What’s the dollar value of orders received by manufacturing firms? How many houses were built? How much did consumers spend at retail establishments? By how much did prices increase?
Folks tend to put more weight on the hard data for several reasons. I’d say precision is the primary one. It’s valuable to learn from the Conference Board how households and consumers feel about the state of the labor market, or from the Institute of Supply Management about how many new orders businesses are getting. But in the end we care about absolute values (“how much/many”) and these surveys’ outputs proxy those absolute values only loosely.
There are secondary reasons, too. The methodology of government statistical agencies is peerless, well-documented and perfected over a long time; I have great respect for top notch surveyors like the ISM, Markit, the Conference Board, various regional Fed banks, and the University of Michigan - just like I have respect for the 1991 LA Lakers, 1992 Portland Trail Blazers, 1993 Phoenix Suns, 1996 Seattle Supersonics and 1997/98 Utah Jazz. Those were all incredibly great teams who lost NBA championships to the Chicago Bulls.
Hard data also tend to be free and quite granular; soft data often have subscriber or freemium models, and their smaller samples limit how much granularity you can measure. You’re not going to get monthly estimates of the average workweek in truck transportation from soft data, but you can get it from the Bureau of Labor Statistics.
The hard data also have shortcomings. They’re almost always less timely than the surveys; we get PMI surveys about manufacturers’ new orders and shipments 4-6 weeks ahead of the Census Bureau’s release. And they’re often susceptible to (sometimes substantial) revisions, as statistical agencies try to improve the accuracy of their estimates.
3. Why the supposed disagreement between the two is mostly illusory
As stated in the prior section, hard data measure concrete values: how many people were employed or how many widgets were ordered. And the soft data usefully attempt to proxy this by asking firms and households “did you employ more or fewer people”, “are jobs hard or easy to find”, and “did you get more or fewer orders for widgets”.
But soft data also ask two other types of questions. Some of those are questions about concrete things that will happen in the future: “how many widget orders do you think you’ll get in 6 months” and “will jobs be harder or easier to get in 6 months?”
The 3rd type of questions is what I call vibes-based, which ask households about vague or abstract concepts. “How do you feel about the economy?” and “How do you feel about general business activity?” It’s not clear what these correspond to in the real world.
An overarching point is that many (but not all) of these surveys create a composite index that mashes up 2 or 3 types of questions, and that composite is usually what grabs headlines as “soft data”. But as you can guess, you’d only expect questions in category 1 (concrete, current) to closely correspond hard data. And I’m guessing a lot of the supposed “hard”/”soft” divergence comes from an inappropriate comparison of hard data to the other 2 categories.
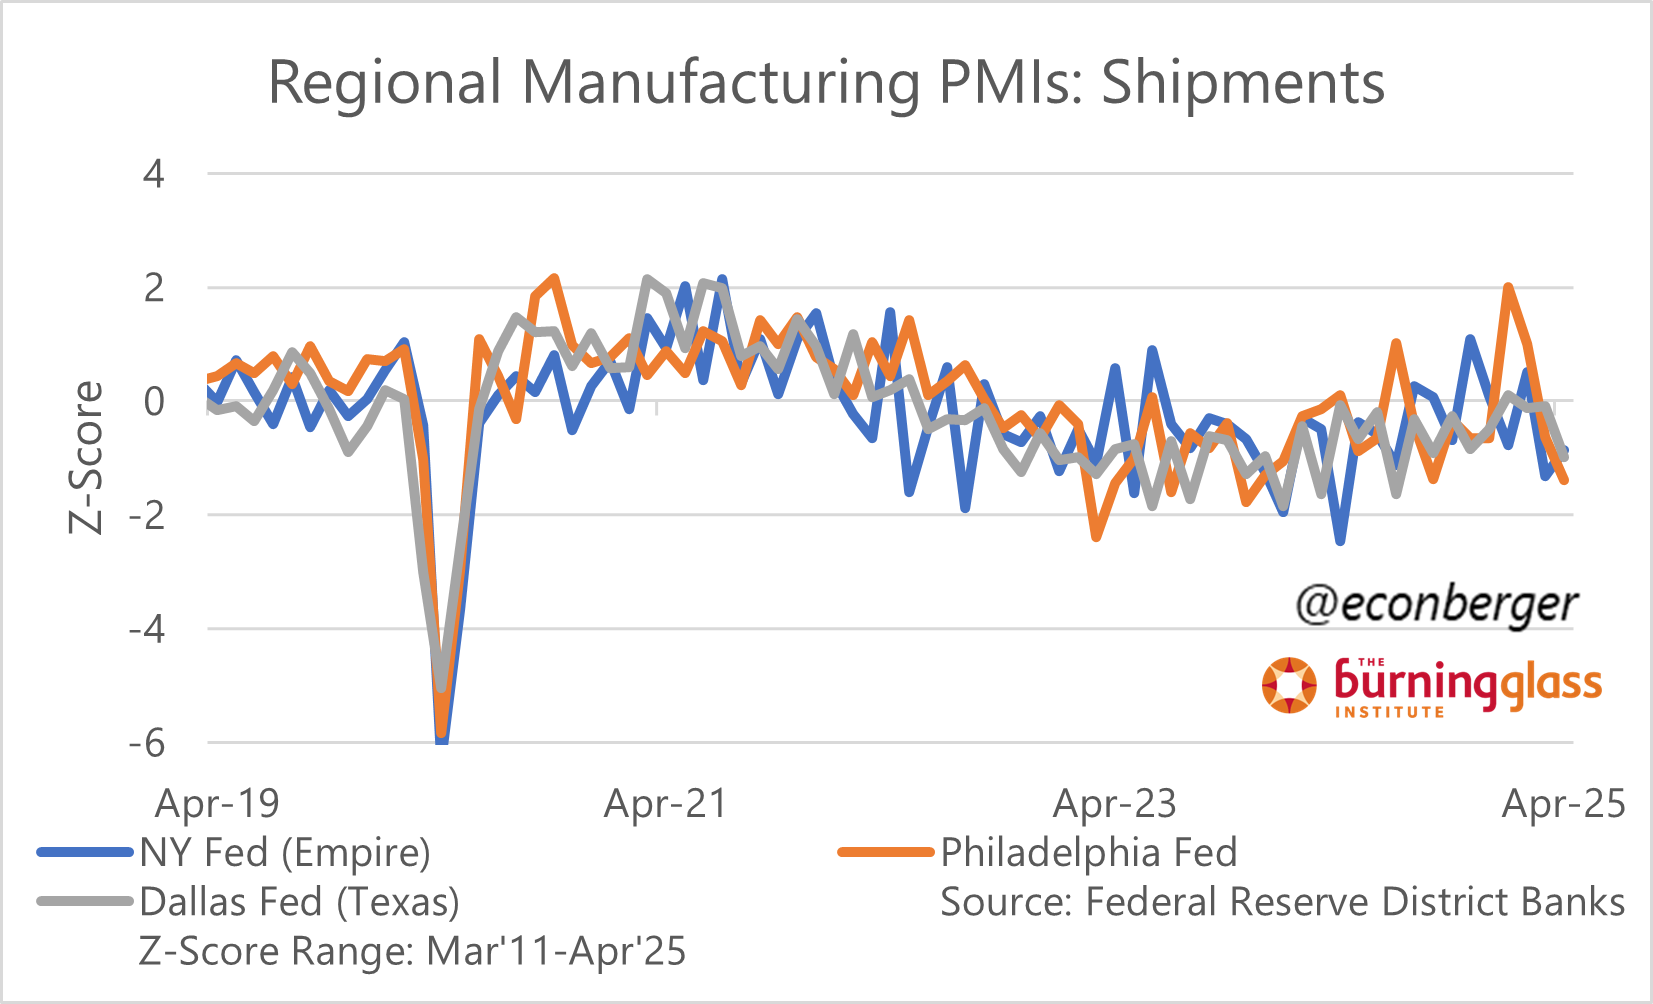
Let me give an example. Some of our most timely soft data come from the regional Federal Reserve banks, which publish surveys of manufacturing and non-manufacturing activity. Some of these surveys ask a canonical “vibes-based” question about general activity. These measures collapsed looked very ugly in April - arguably, the worst since the Pandemic.

Other questions ask about future conditions. Both consumers and businesses are very pessimistic about 6 months from now; for example, here are expectations of 6-months-ahead shipments, which look even more abysmal than general activity.

When you look at current shipments (which fits into category 1 - concrete, current), you also see a worsening, but it’s nowhere near as bad. At worst, we’re tracking against the very shallow 2023-24 slump.
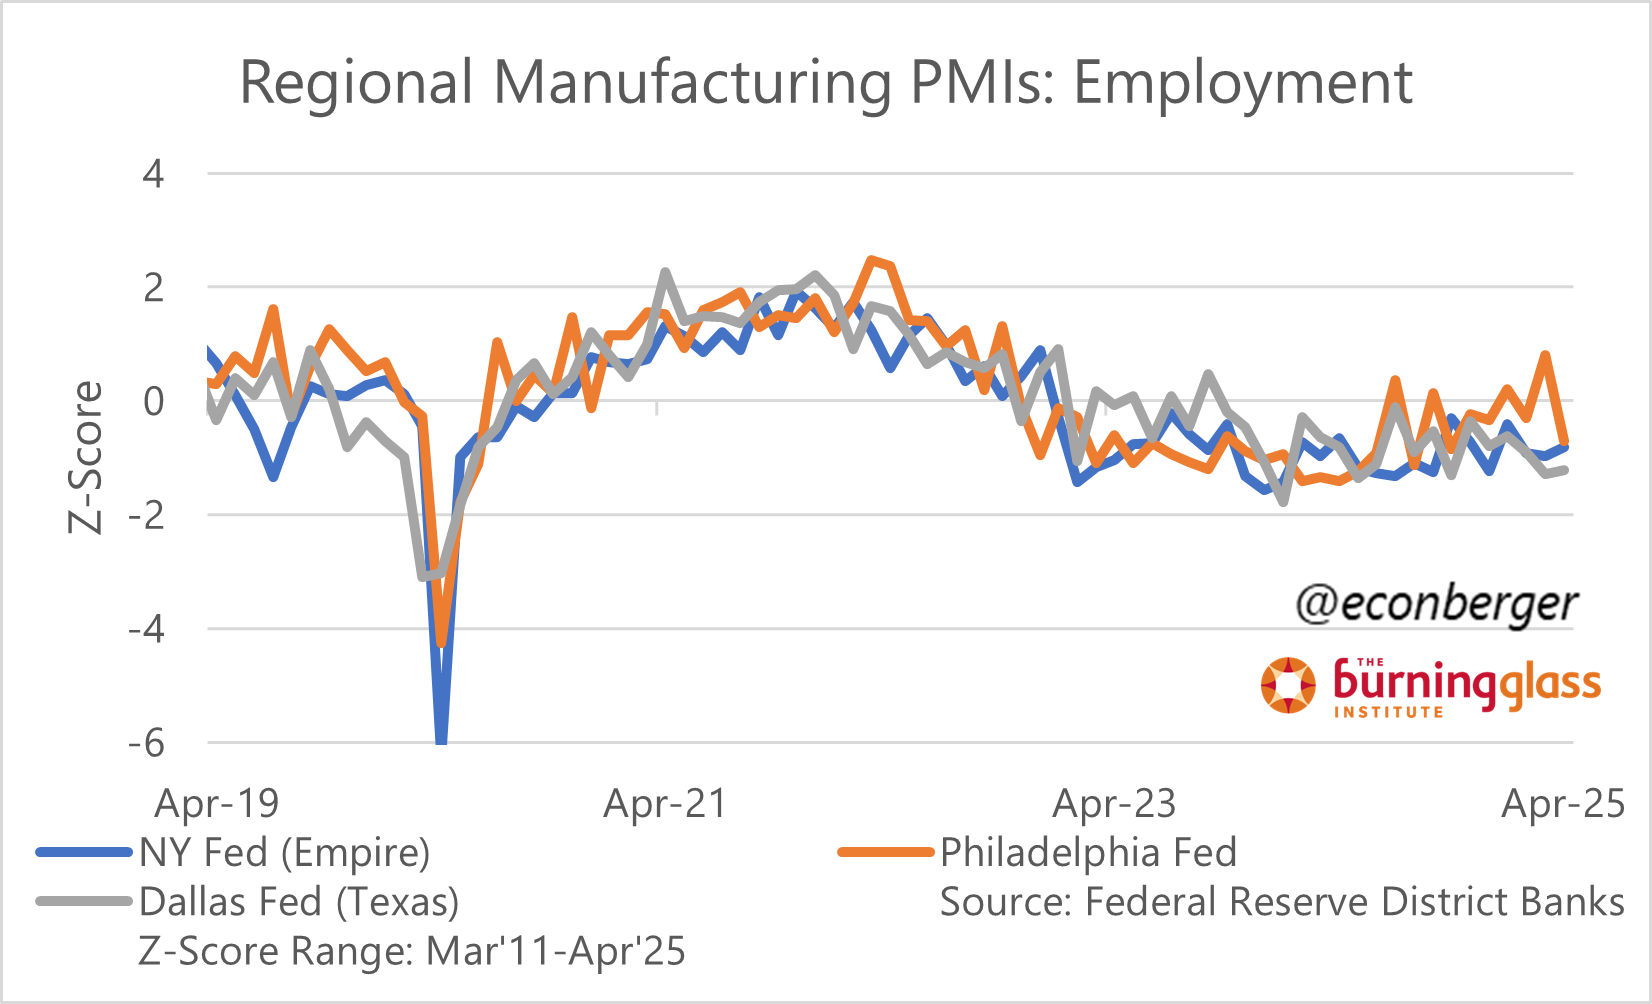
Employment is even more even-keeled. If you’re wondering why hard data from the BLS and DOL shows employment doing OK… the soft data from these surveys tells you exactly the same thing!
Of course, we have one bit of current, concrete soft data that is also forward looking: new orders. It’s doing poorly, and if it sticks, I’d expect a lot of the hard data and “doing OK current concrete” soft data to do a lot worse within the coming months:

4. Conclusion
The way I’d wrap this all up: the soft data mostly looks worse than the hard data not because the hard data is wrong, but because a lot of soft data (including composite indices that grab headlines) are forward-looking or vibes-based. The parts of soft data that correspond to the current situation, and correspond to concrete features of household or business economic activity (like employment or shipment) are not deteriorating nearly as much - similar to the hard data. If the current situation deteriorates, I’d anticipate that both the hard and corresponding soft data will worsen in tandem.