
Recap: CES Preliminary Benchmark Estimate (March 2025)
A big slice off nonfarm payroll employment, as expected

TL;DR: The BLS’s preliminary benchmark estimate was for the March 2025 level of nonfarm employment to be reduced by 911,000, not far from what I expected. This does not change my perspective on the state of the labor market, which is “stable for much of the past year, but with renewed cooling recently”.
Table of Contents
What’s a Benchmark Revision
Summary of the Revisions
What’s Next?
What Caused the Revision?
Things That Didn’t Change
More below table.
1. What’s a Benchmark Revision
Every year, in the January jobs report (released in early February), the BLS applies an annual revision to historical Current Employment Statistics (CES, or “establishment survey”) data within the report. The most scrutinized revisions are those applied to nonfarm payroll employment, though other widely-reported CES data like hours and earnings are also revised.
An important chunk of that annual revision is application of an employment benchmark to CES data corresponding to March of the prior year. Because we think of a lot of CES data in terms of delta rather than in terms of level (e.g. employment growth), the benchmark revision alters not only data from March of the prior year, but also for the entire year before that. So for example, the January 2026 report will directly apply a benchmark revision to the level of March 2025 data, and THAT revision will cause revisions to monthly data from April 2024 (the month after the prior benchmark date) and March 2025.
The reason the BLS does this is because the CES’s sample of establishments can drift off course from representing the economy. Establishments are created (which can lead to undercounts of employment), destroyed (which can lead to overcounts of employment), and the benchmarking exercise is a useful way of correcting that drift.
The source data for the benchmark data is the BLS’s Quarterly Census of Employment and Wages (QCEW), which is based on a more thorough universe of data sourced from unemployment insurance data. QCEW data is released with a 5 month lag relative to the CES. For instance, this morning, the QCEW released Q1 (January through March) 2025 data; we already have CES data for August. For the CES benchmark, it’s this Q1 late summer release that matters the most, because the year-over-year QCEW change as of March generates the CES benchmark revision estimate.
This morning, using the aforementioned QCEW data, the BLS published a preliminary benchmark estimate telling us by how much they anticipate the March 2025 payroll employment level will change.
Before moving onto recapping the data, I want to make a few points:
Key indicators like the unemployment rate, U-6, the prime working age employment population ratio, part time for economic reasons, etc. are untouched by the revision.
The final benchmark revision will probably be slightly less negative than the preliminary estimate.
The benchmark revision does not apply to data past March 2025.
The existing, unrevised time series for nonfarm payroll employment will remain in place (unrevised) until early 2026 when the annual revision is implemented.
2. Summary of the Revisions
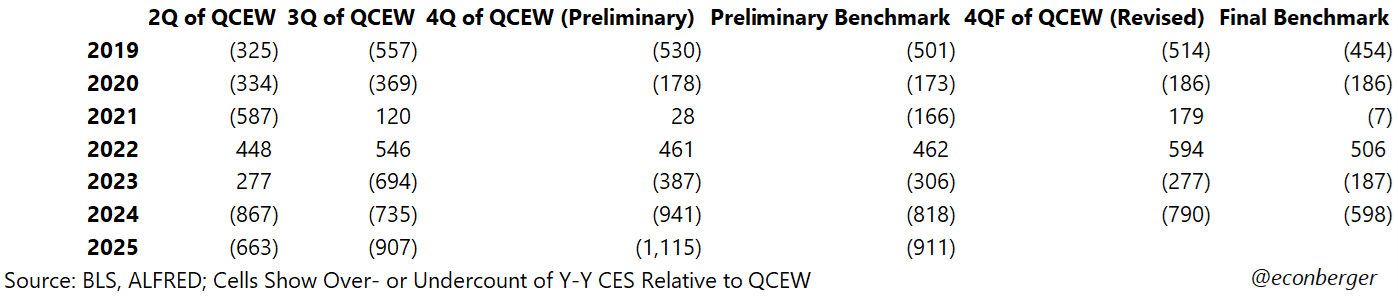
-911,000 is a big downward number. It’s the biggest on record in absolute terms, and in percentage terms (-0.6%) is the largest since the Great Recession. It’s also follows fairly large downward benchmark revisions in 2023 and 2024.
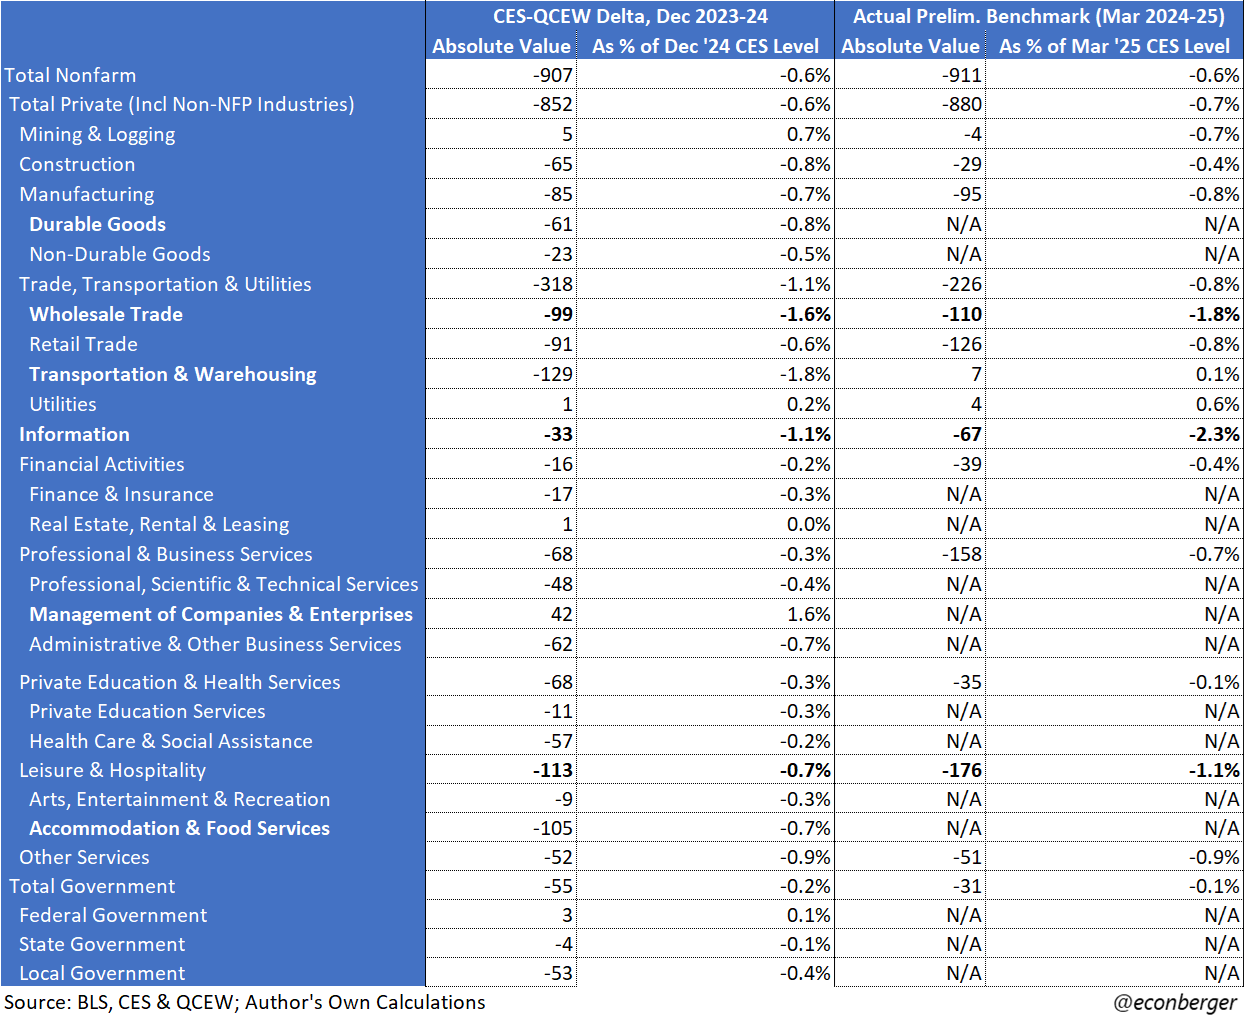
You can see the industry distribution of the revisions below, side by side with a scrappy faux-prediction I made using the 3 quarter QCEW data. In absolute terms the biggest downward revisions came from leisure & hospitality (-176K), professional & business services (-158K), retail trade (-126K), wholesale trade (-110), and manufacturing (-95K). In percentage terms the biggest downward revisions came from information services (-2.3%), wholesale trade (-1.8%), leisure & hospitality (-1.1%), and other services (-0.9%).
Upward revisions were rare, but we did see them in transportation & warehousing (+7K, +0.1%) and utilities (+4K, +0.6%).
3. What’s Next
For now, the unrevised nonfarm payroll employment data will remain in place. In other words, the monthly NFP numbers you download from the BLS, FRED, Bloomberg, Haver or your favorite data providers will overestimate employment growth for the period from March 2024 to March 2025. You may want to implement a downward adjustment mentally and in any visuals you produce/consume.
The next key milestone is early December, when the BLS will release its Q2 2025 QCEW data. That release will include revisions to the Q1 2025 QCEW data, which will likely be positive. Based on the pattern of the last 6 years, I’d expect the upward revision to be about +120K.
That also means that the preliminary benchmark estimate is probably going to be revised up - my point estimate is +83K. In other words, we’ll have a final benchmark revision of around -828K instead of -911K.
From the perspective of post-revision employment gains, what I’m saying is that a naive implementation of the preliminary benchmark estimate would lower employment gains would result in the rate of monthly employment gains between March 2024 and March 2025 falling from +146K/month to +70K/month - but a more realistic expectation based on historical patterns suggests +77K/month is more likely.

The final benchmark revision will be incorporated into the monthly CES data in early February 2026. There will also be other non-benchmark revisions implemented. Less importantly, the historical seasonal adjustment factors will be revised (usually this just smooths out the history). More importantly, the BLS will recalculate the post-March-2025 data (which will at that point run through January 2026) using new net birth/death (NBD) model estimates.
An item of contention until we get more QCEW data is whether the CES overcount is ongoing, past the March 2025 benchmark date. Some people (myself and Governor Waller included) think it’s possible; others don’t. I think evidence is currently nearly non-existent - it’s purely speculative. We’ll get an early tease of this possibility in December 2025 (with the Q2 2025 QCEW data) and more information next year.
4. What Caused the Revision?
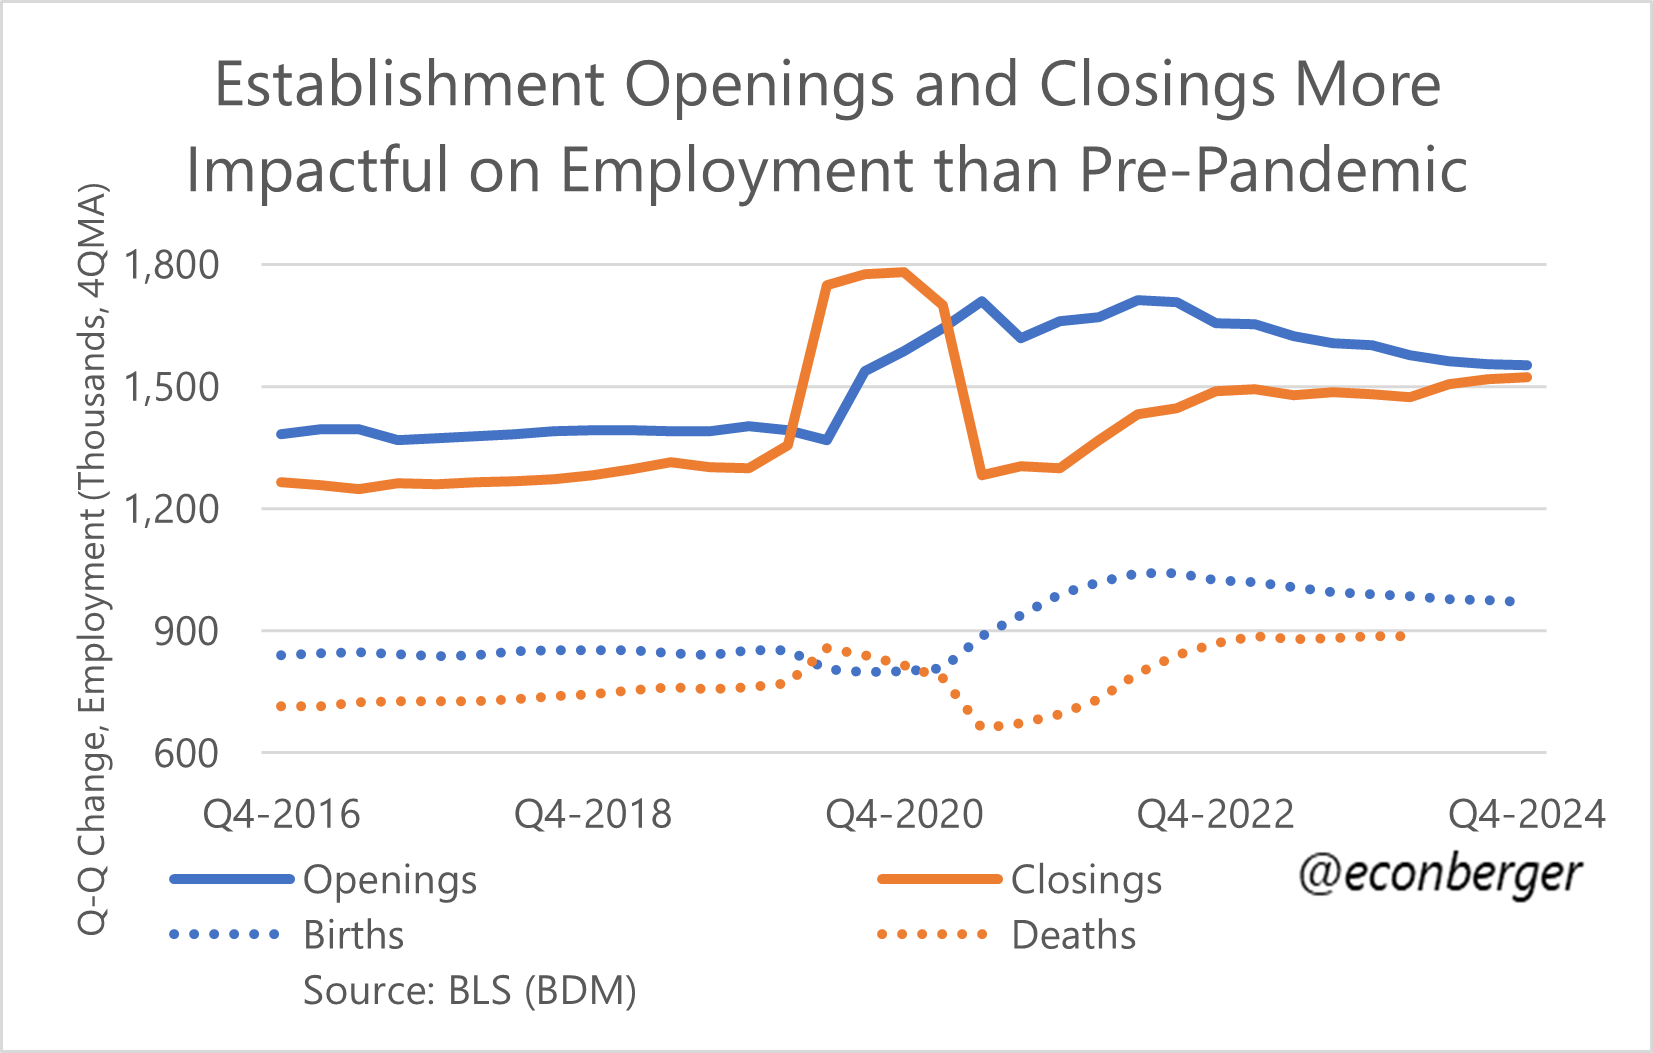
Last quarter I dug into the Business Employment Dynamics data set (which is based on the same QCEW source data as the annual nonfarm payroll employment revision) and have a hypothesis. As mentioned earlier, the net birth/death model (NBD) is the primary source of drift in the nonfarm payroll employment count. Data on actual job creation and losses at born/dead establishments is laggy and the BLS uses the NBD model to fill in the gap until the data is available. Those assumptions are non-trivial and when they’re wrong, big revisions (up or down) are inevitable.
What has the model gotten wrong? Well, one possibility is missing the ongoing downward drift in employment growth due to establishment births. Perhaps the BLS expected this to stabilize or even rise, but it’s moving in an adverse direction.
Another and possibly more significant surprise has been a recent increase in job losses due to establishment closures. These were stable over the past few years - the deterioration in actual net birth/death was coming from weaker births. But we did see establishment closures rise during in 2024.
I said “closures”, which is not the same as “deaths”. Death data lags (in terms of publication) relative to births, openings and closures. But it’s reasonable to speculate that a lot of those closures will prove to be deaths. And there’s a pretty good chance that (speculative) increase in job losses due to establishment deaths was not anticipated by the BLS model.
5. Things That Didn’t Change
If you follow this newsletter closely, you know that I use the phrase “household survey ratios” relentlessly. There a few reasons for that. The first is that these ratios are mostly unaffected by the wild swings in labor supply growth we’ve experienced due to immigration policy in the post-pandemic period. Another is that they are entirely immune to the benchmark revision that dominates the first 4 sections of this post.
Yes, you have that right: the unemployment rate, the prime working age employment population ratio, prime working age labor force participation, the share of the labor force working part time for economic reasons, the share of the labor force unemployed due to permanent layoff, and many other indicators are absolutely unaffected by today’s revision.
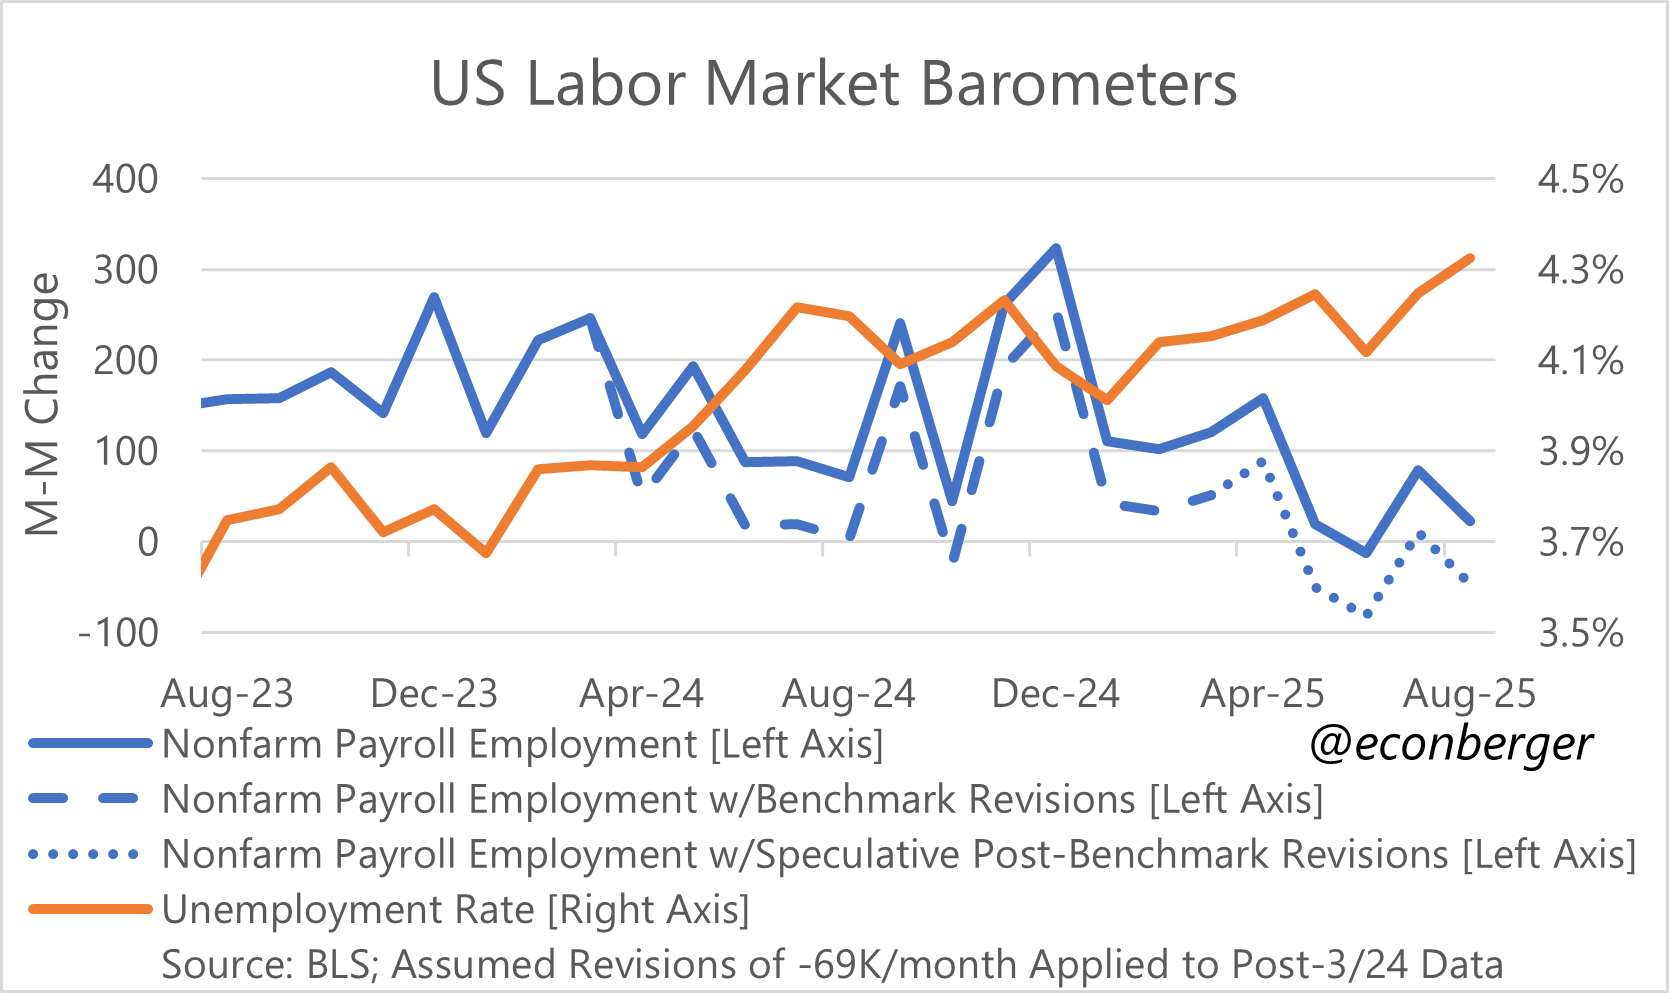
Look at the chart below. What we learned today is that, through March 2025, job growth was probably the dashed blue line instead of the solid blue line. (And much more speculatively, we’re wondering whether post-March-2025 we’re still in a dotted blue line environment.) The orange line didn’t budge. If you want to know what’s really going on the labor market, focus on the orange line and spend less time thinking about the blue lines.
Guy - I understand that the household survey numbers *don't* get revised, but are there any grounds for thinking that perhaps they *should*? Survey response rates have fallen there too, after all. In other words, how confident can we be that the monthly unemployment data are accurate?