


High Frequency Labor Market Indicators (3/05)
Claims, Challenger Job Cut Announcements, and QCEW

TL;DR: The claims data through late February still shows a relatively muted impact from various DC policy actions, though layoffs are clearly above year-ago levels.
I’ll cover 3 data points in this post:
Claims for Unemployment Insurance
Challenger Job Cut Announcements
QCEW revisions
More below chart.

1. Claims for Unemployment Insurance
We’ve been waiting for evidence of layoffs in the federal government to show up in the unemployment insurance data, and this week’s release finally showed them. Initial claims for federal workers (the UCFE program, which is not included in the regular weekly claims data) spiked in the week ended February 22nd. That said, the increase was quite small: just 1,000. I suspect bigger numbers are ahead.
Another place where we might expect an impact is in regular claims data, in regions with lots of federal workers. Recipients of government money that have been impacted by freezes and disruptions, contractors, and businesses that provide goods and services to government workers would all show up here. So far there’s a noticeable but small (in absolute terms) impact in DC, but not in Maryland, Virginia, Alaska or Hawaii (the states with the biggest reliance on federal employment).

Turning to the national regular claims data, the spike we saw last week (also the week ended February 22nd) unwound, and we’re back in the mid/low 220s.
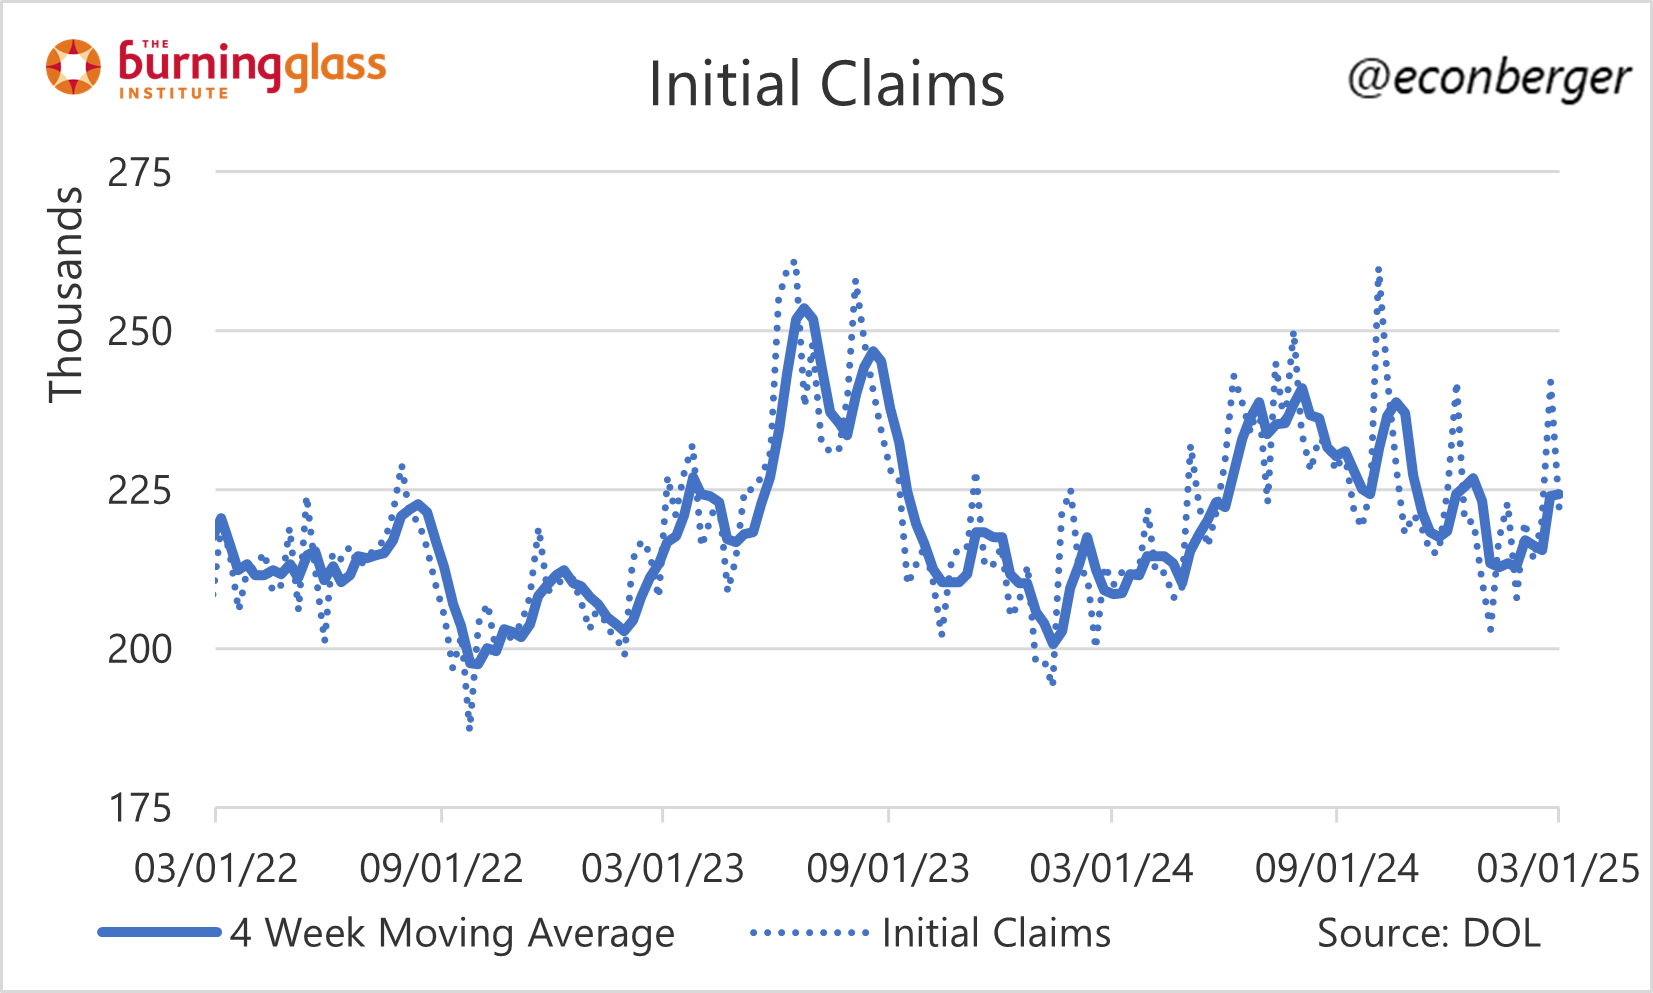
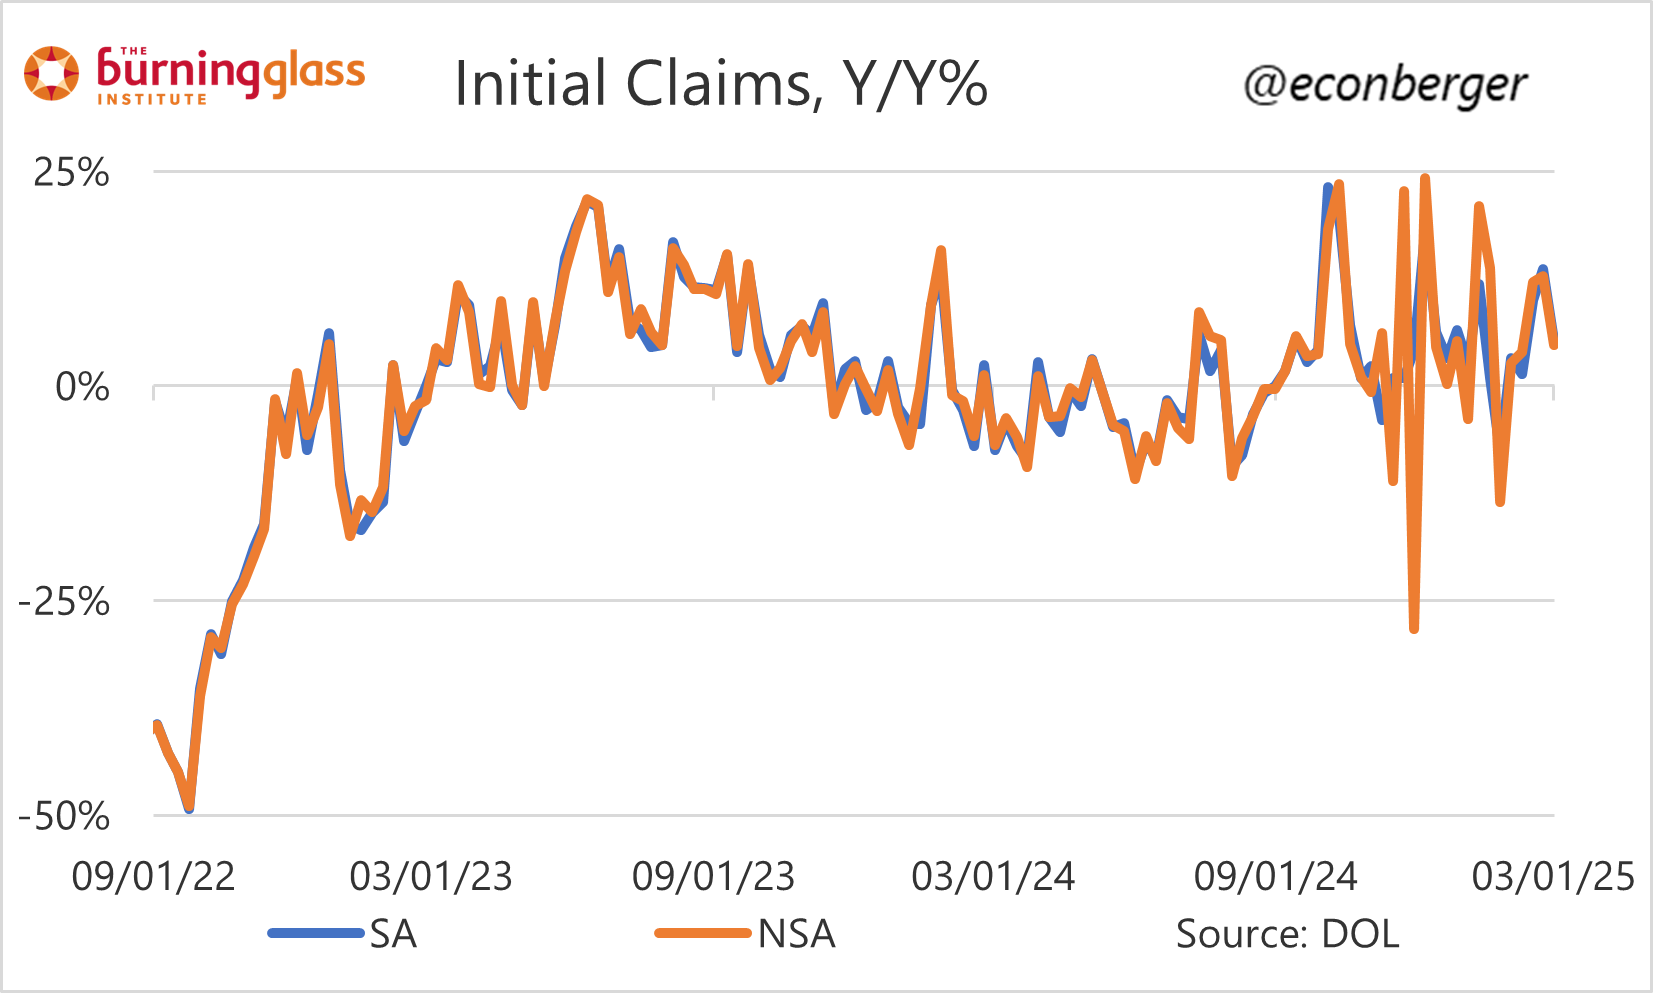
That’s somewhat reassuring, but claims are still a moderate amount above year-ago levels. This pattern of rising layoffs (at least relative to a year ago - unclear if it’s ongoing) started in late summer or early fall 2024, and is apparent across a wide range of indicators from different sources.
Continuing claims are also a moderate amount above year-ago levels. I don’t know whether the seasonal adjustment is working properly here - have we plateaued after a one time increase in late 2024, or have we just experienced a steady ongoing increase? I don’t know.

In any event, I don’t see anything too alarming yet. There is small-scale bad news that all post-dates tomorrow’s monthly BLS jobs report, and would impact the March report. I expect the bad news to intensify over the next few weeks, but exactly by how much is unknown.
2. Challenge Job Cut Announcements
The staffing firm Challenger Gray & Christmas has, for many years, generated headlines by kindly tallying public job cut and hiring announcements. Today it once again landed on the front pages with the single biggest month of announcements since 2020 (and the worst February since 2009). Should we freak out?
In my experience, the Challenger data is informative directionally but gets the magnitudes wrong. In early 2023, it showed a massive supposed spike in layoffs that never materialized - though layoffs did increase (by a relatively amount). And its surge at present is aligned with a small increase in layoffs.
What’s causing the disconnect? It’s important to remember that the Challenger data capture only a relatively small subset of actual layoffs (as measured by the JOLTS survey). My guess is that sample is not representative - companies monitored by Challenger have just been overrepresented in overall layoffs over the past few years.
I don’t think this is a serious problem with the data - it suggests Challenger job cut announcements provide signal - and that with the proper statistical transformation, you can calibrate that signal to real-world magnitude. I just wouldn’t take its untransformed values literally.

3. QCEW Revision
Two weeks ago we got the Q3 QCEW data, which suggests a moderate overcount by the establishment survey (CES) in the 6 months since the last benchmark revision (March 2024). But today we also got a revision to the Q1 and Q2 QCEW data, and the Q2 data in particular was revised upward by a non-trivial amount.
I mention this because the Q2 QCEW data generated anxiety among labor market doomers. But there was also good evidence to believe, based on historical patterns, that it would get revised upward (which is in fact what happened).
We are still trailing below the CES count in the first two quarters of the post-benchmark period, by about 485K. We still have two quarters to go before we get the preliminary benchmark estimate for March 2025. Predictive value of the QCEW this early is fairly weak; at most, we can say “the eventual benchmark revision will probably be negative, with unclear magnitude”. What I definitely wouldn’t do: prorate the current CES overcount (i.e. 2 x 485K = 970K).
