
High Frequency Labor Market Indicators (4/09)
A Mixed Bag

TL;DR: Generally decent data from the tail end of March and the start of April; some better, some worse.
This post covers:
Recent and Upcoming Publications
What’s Next
Update on the War’s Impact on the Labor Market
Claims for Unemployment Insurance
Morning Consult Unemployment Rate Index
ADP Weekly Employment
Unemployment Rates for Young People
Current Population Survey Response Rates
More below chart.

1. Recent and Upcoming Publications
I have a list of overdue writing that I’ll get to one of these days (sorry!), but until then you can read my recaps of the March jobs report and February JOLTS, as well as my 2026 labor market outlook.
2. What’s Next
We get the March JOLTS report on Tuesday May 5th and the April BLS jobs report on Friday May 8th.1 Other upcoming items of interest include the Q1 employment cost index (ECI) on April 30th and the Q4 Quarterly Census of Employment and Wages on June 2nd.
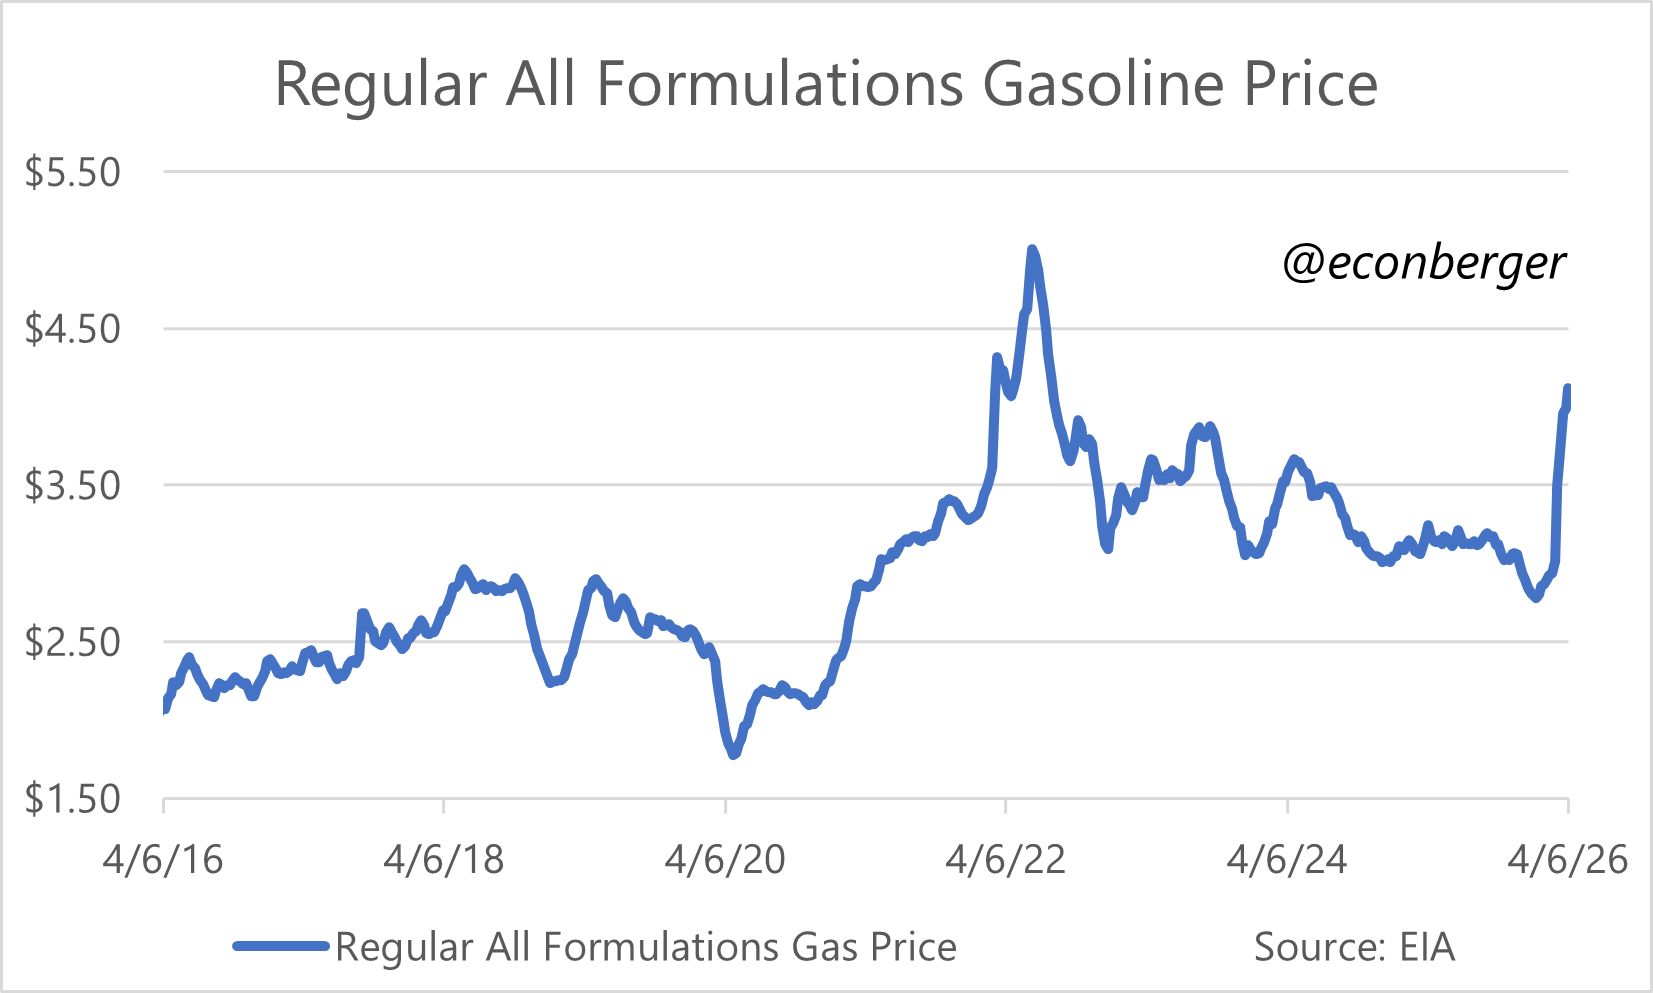
3. Update: The War’s Impact on the Labor Market
The state of the Iran-US ceasefire is unclear, but the Strait of Hormuz remains mostly closed. Until that reverses, I’m going to stay worried about the impact of skyrocketing gasoline prices on US labor market. That said, as you can see from the data on this report, none of that impact has shown up yet. As always, for deep expertise in the area of crude oil markets, I recommend reading Rory Johnston of Commodity Context or Gregory Brew.
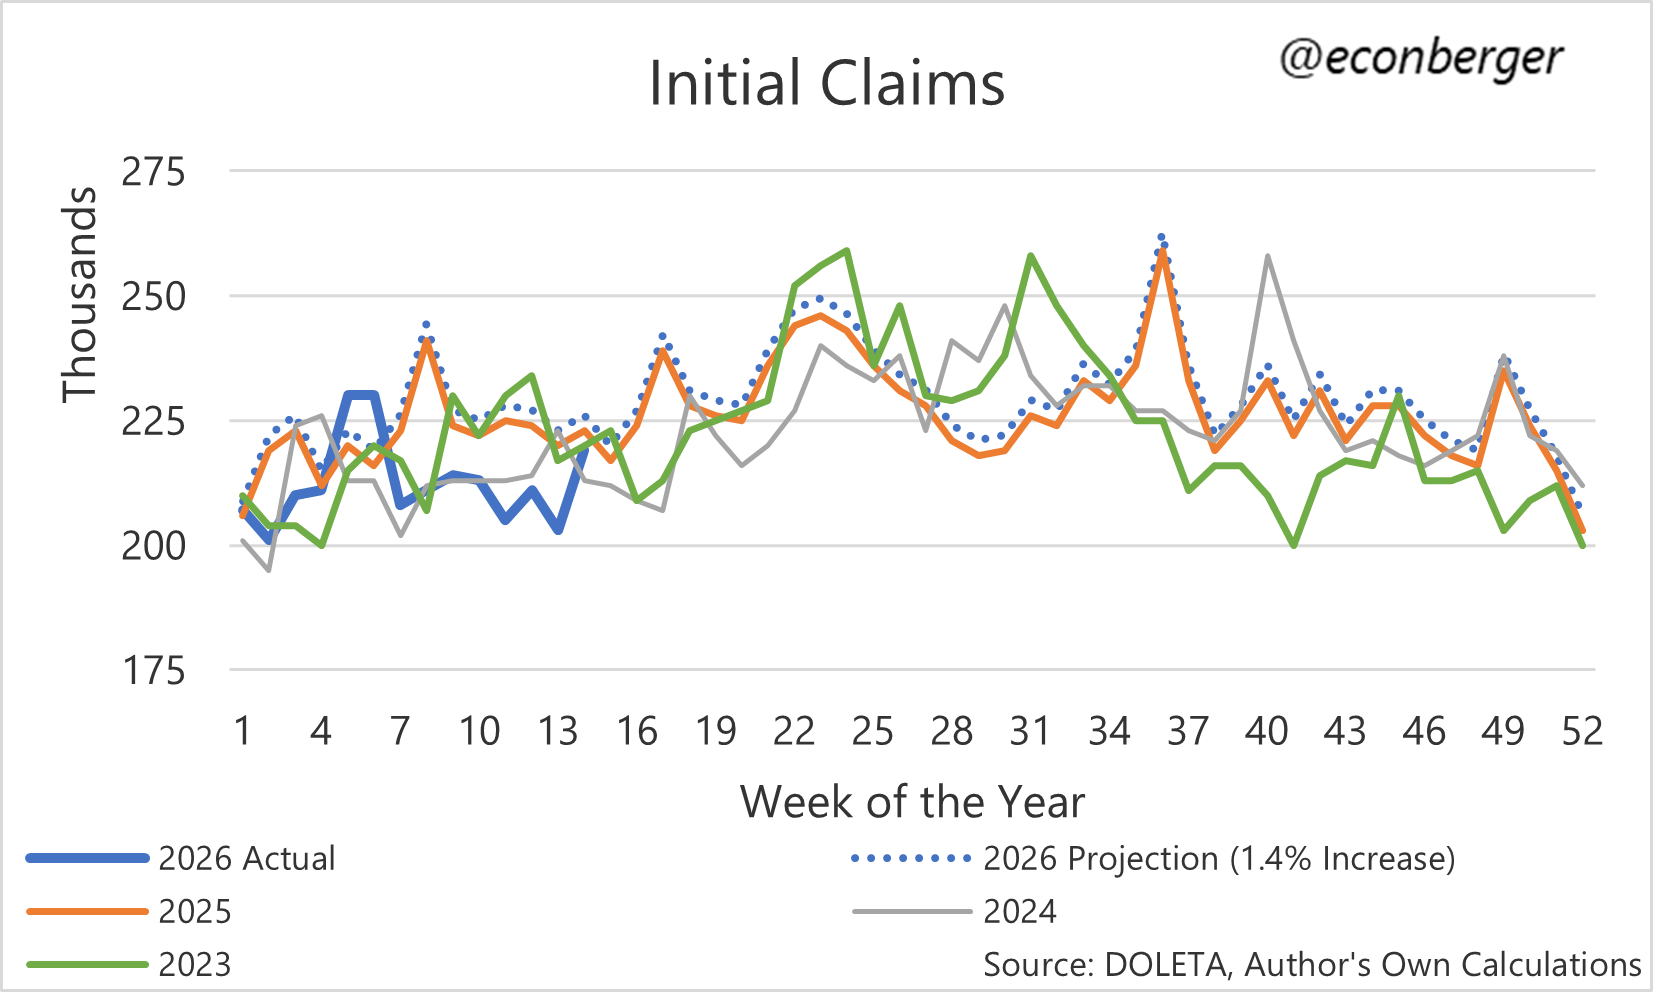
4. Claims for Unemployment Insurance
Initial claims started off April (week ended 4/04) with the highest reading in 2 months; they were still lower than in either 2023 or 2025, but slightly above 2024 levels. If we get similar readings in the next few weeks that will be a sign that the great 2026 layoff decline is abating. But it could just be noise!
Continuing claims, which run a week behind (week ended 3/28), the story remains incredibly upbeat - they fell below 1.8 million for the first time in almost 2 years, and are now below both 2024 and 2025. A heads up that we might experience an increase in May and early June due to residual seasonality - it happened in each of the past 3 years.
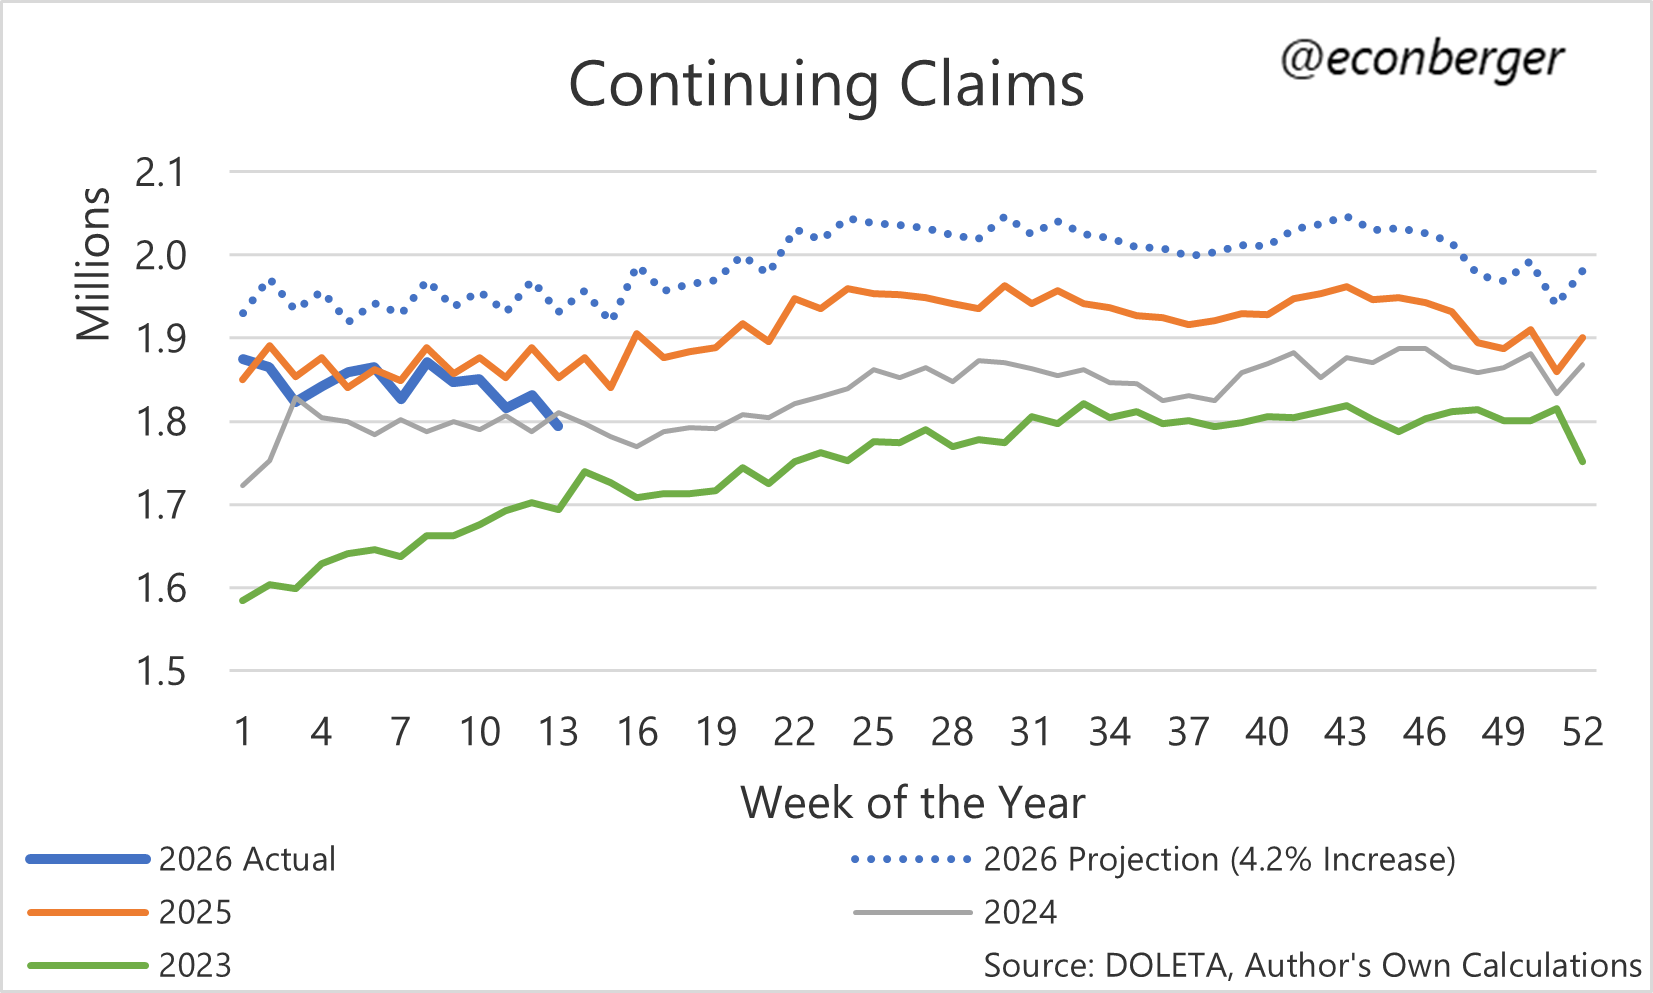
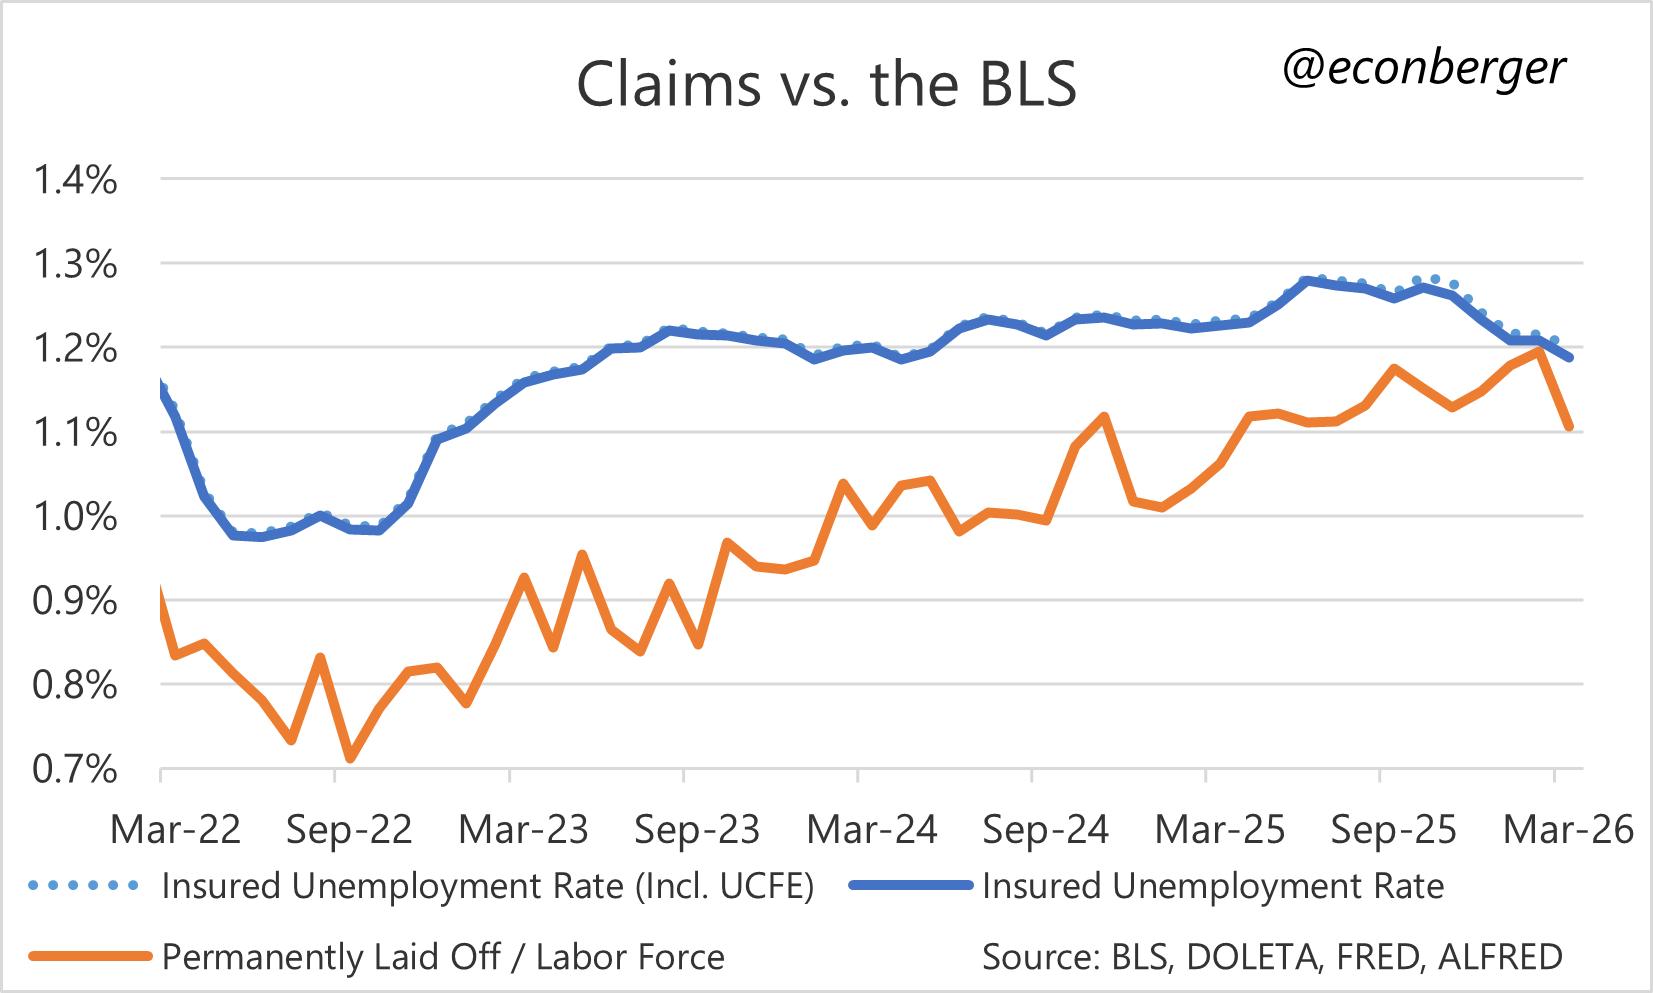
I’m mildly skeptical that the job market is improving as much as continuing claims suggest, because the roughly parallel series published by the BLS (“unemployed due to permanent layoff”) isn’t quite as rosy. It did tick down in March, but is still a little above year-ago levels, unlike continuing claims.
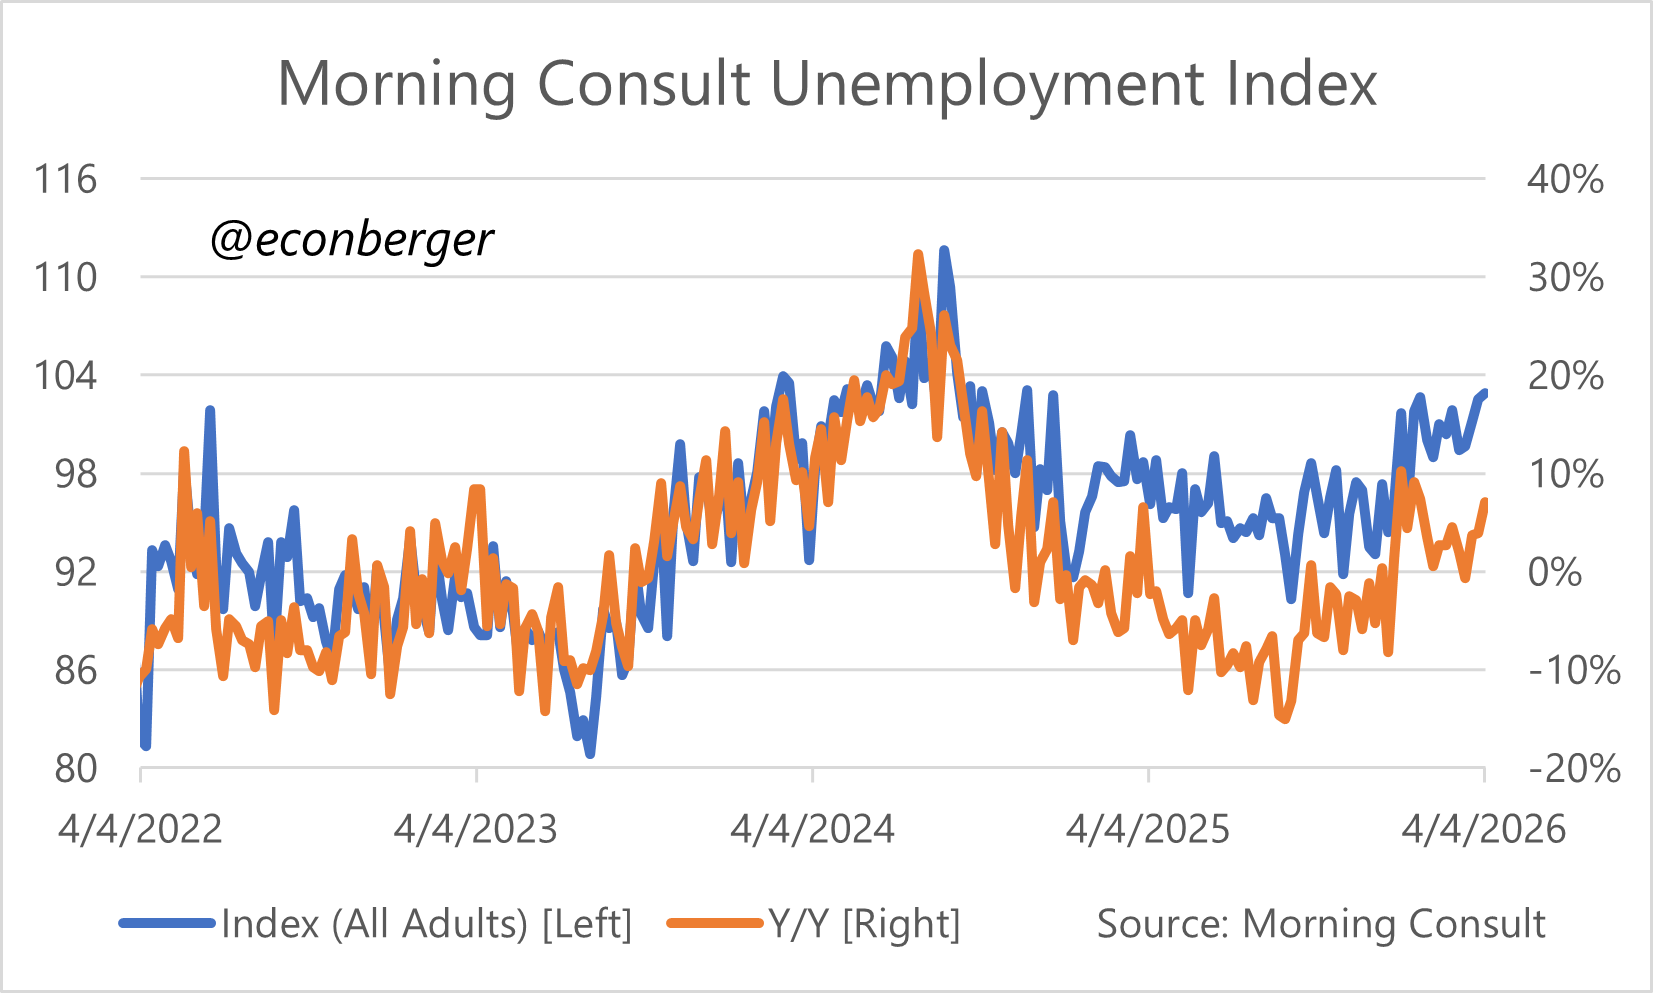
5. Morning Consult Unemployment Rate Index
The folks at Morning Consult published their biweekly unemployment rate index on Monday and it is still running a little above year-ago levels. That’s consistent with a slight deterioration in labor markets since early April 2025, a pattern apparent in many (but not all) economic data.
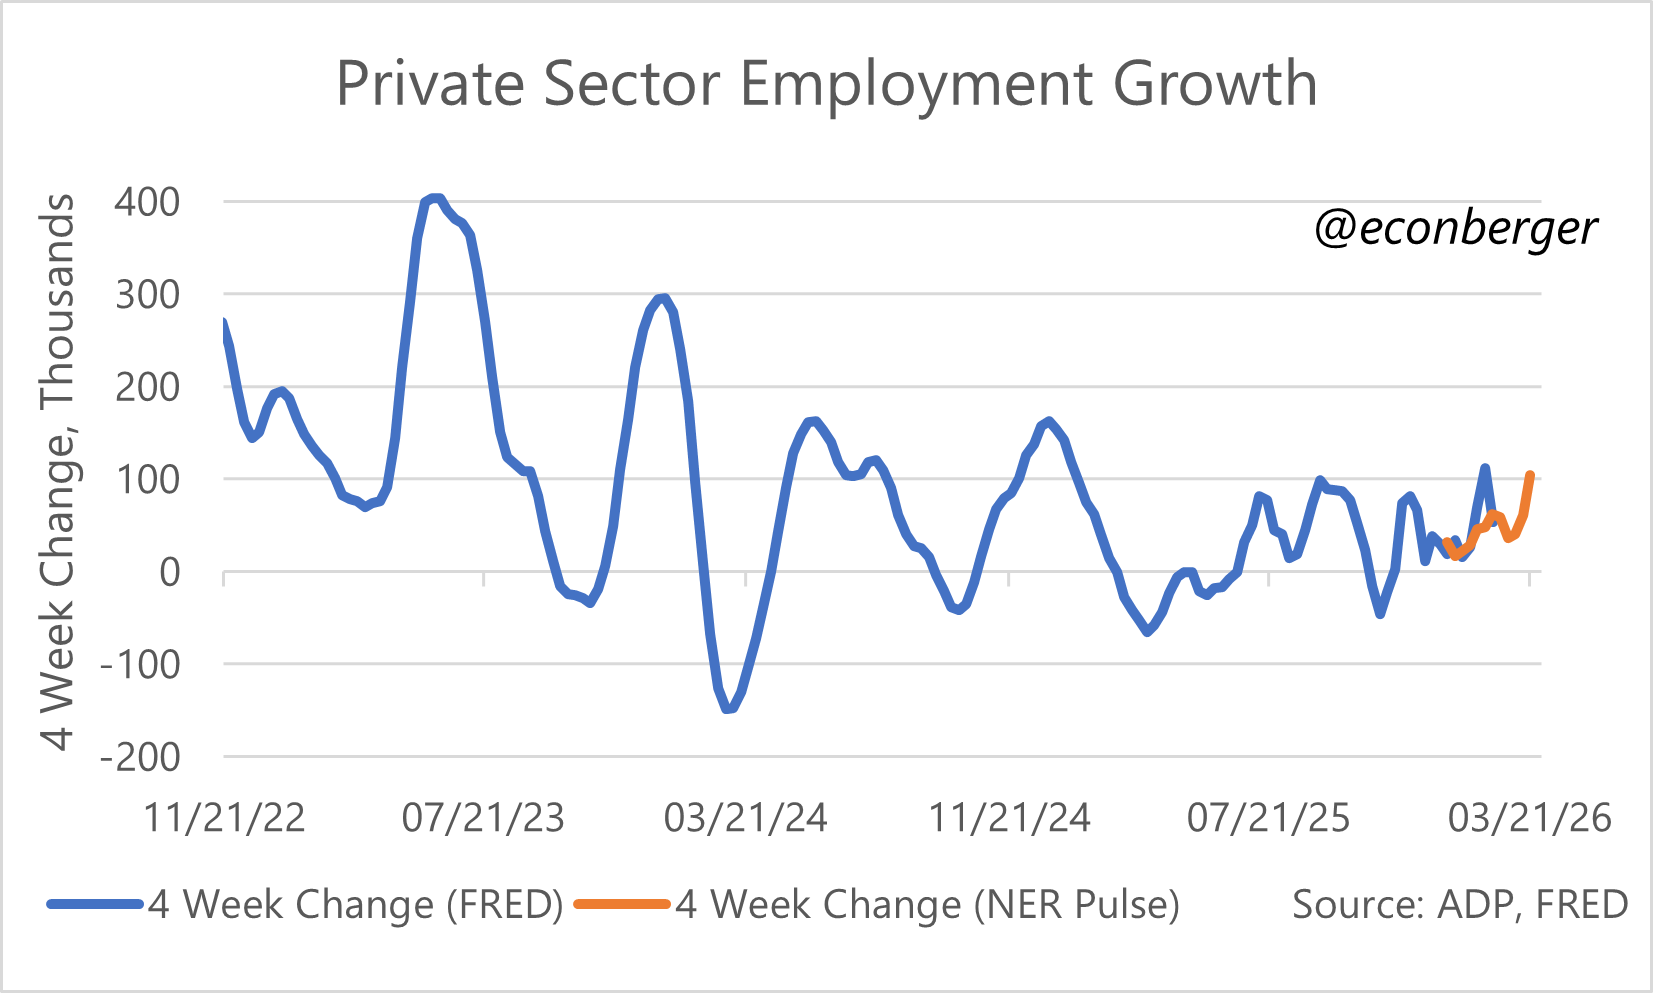
6. ADP Weekly Employment Growth
Not sure how much weight I should assign to this development, but we’ve seen a fairly large acceleration in ADP’s weekly employment growth metric - it’s showing an increase of more than 100,000 private sector jobs since late February.
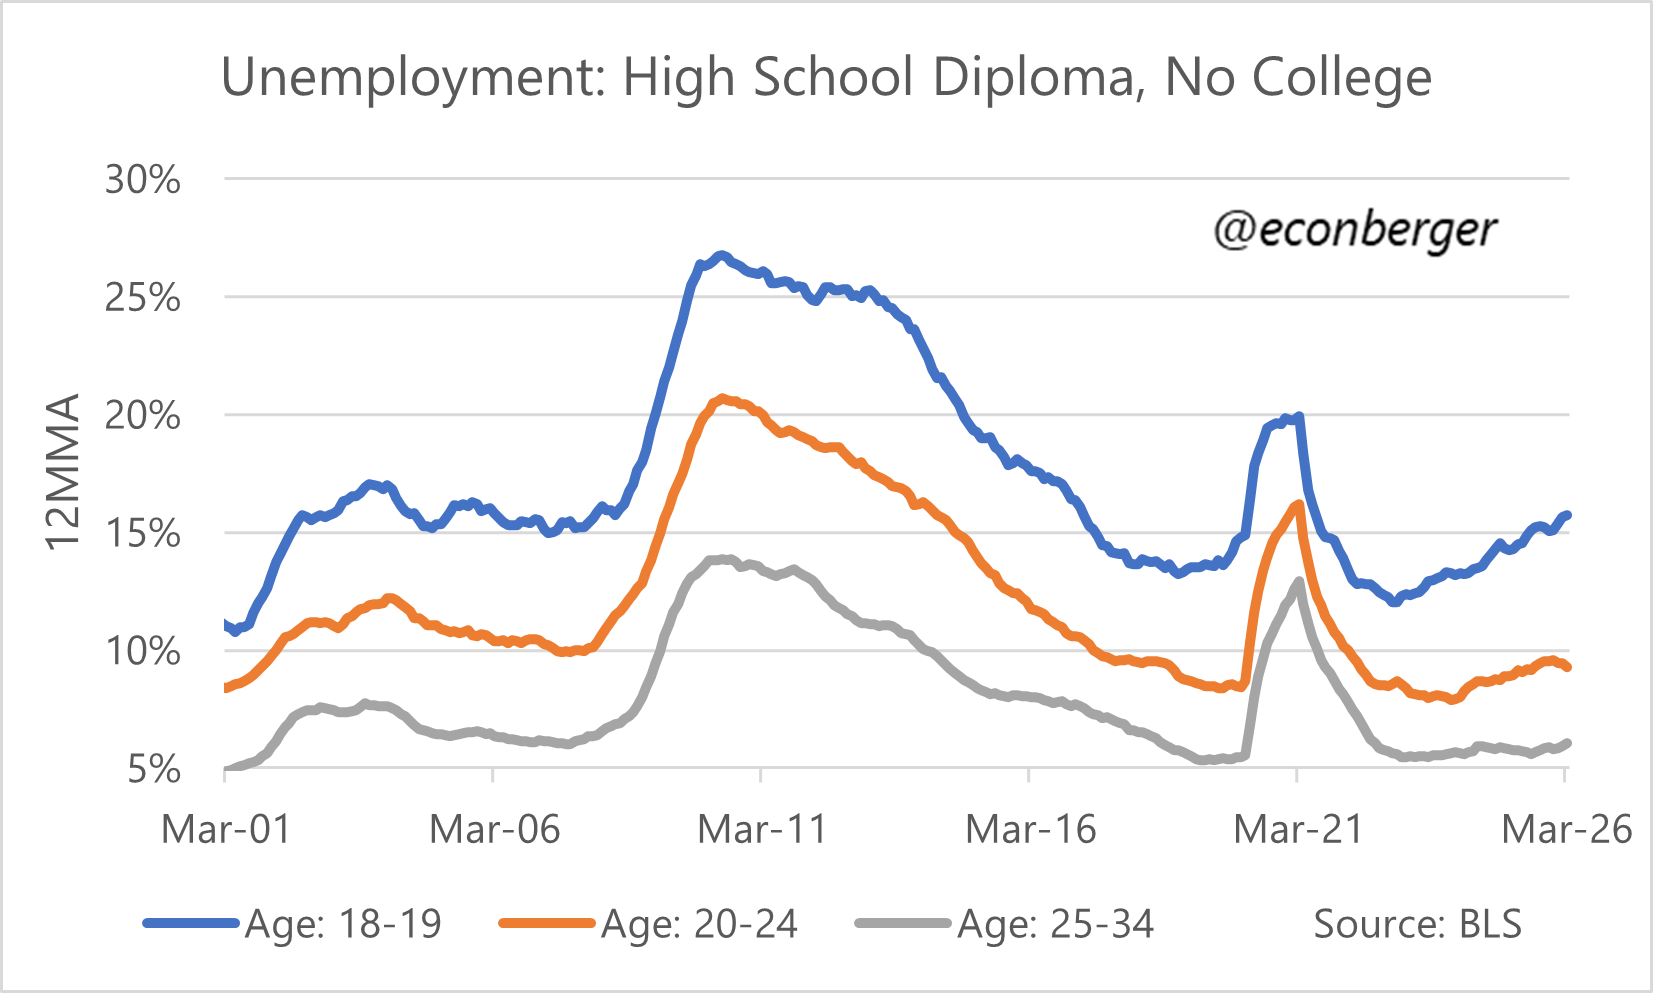
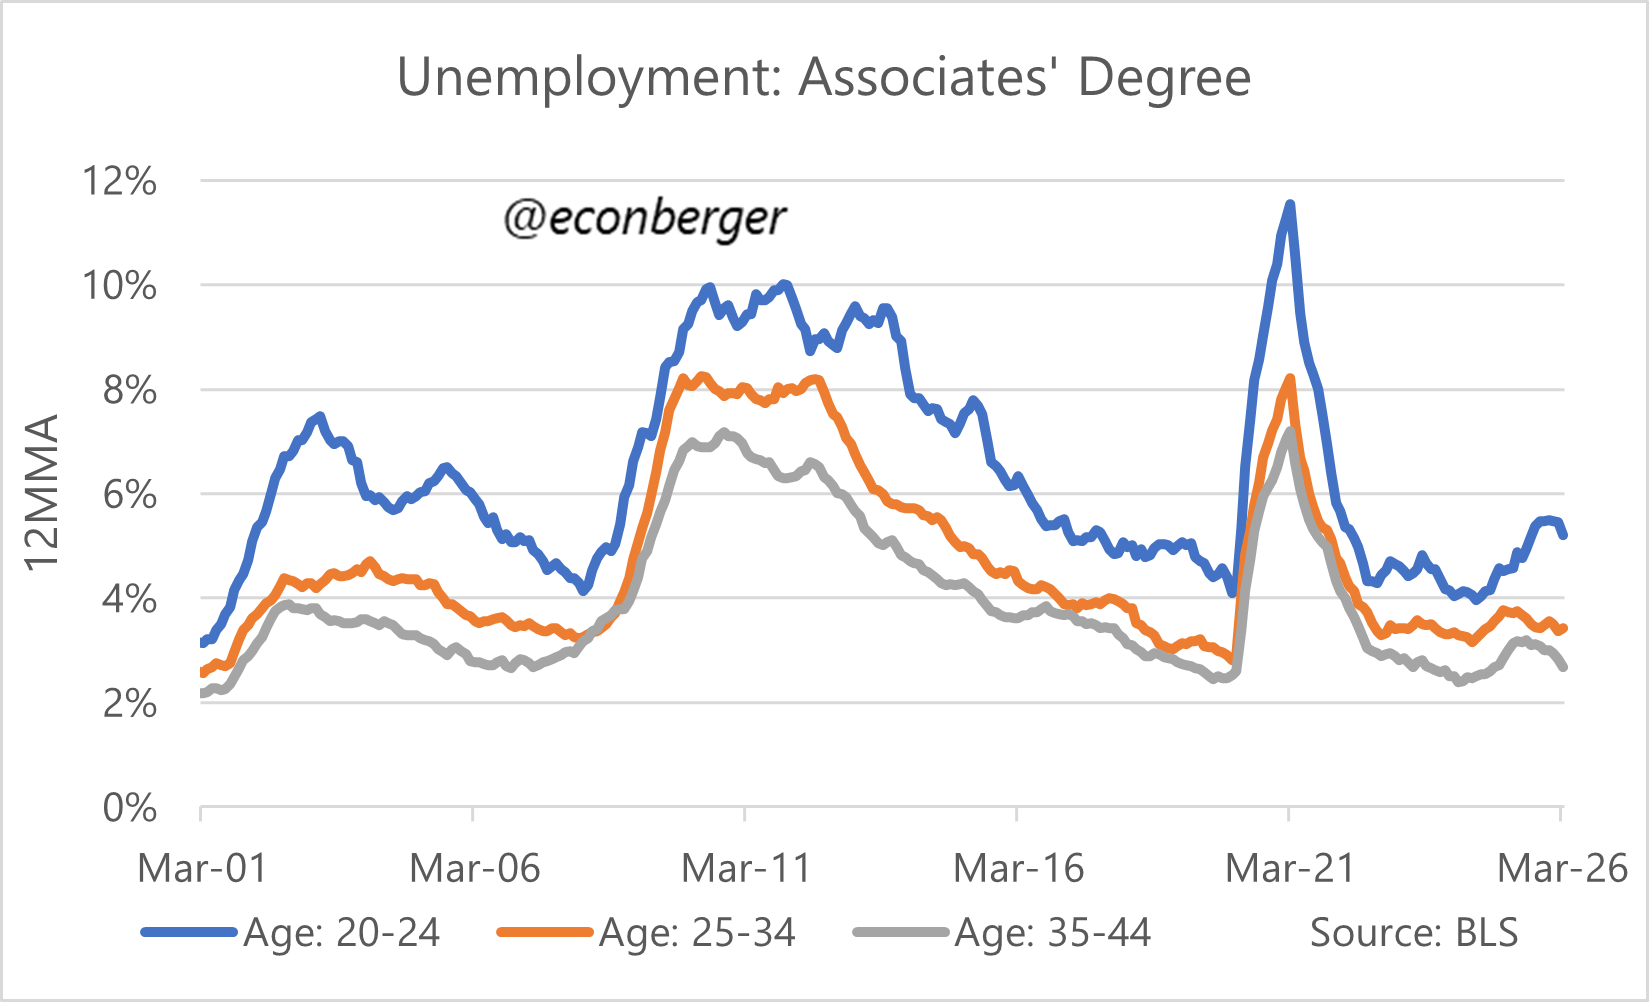
7. Unemployment Rates for Young People
Time for one of my favorite hobbyhorses - the job market has gotten worse for all young people, not just young college grads!
Let’s start with people in their late teens who have a high school diploma and no college experience. Their unemployment rate has averaged 15.7% in the past year, comparable to early 2017 levels. A year ago this measure was at 14.3%, and 3 years ago it was at 12.4%. That’s a meaningful worsening!
For high school grads without college experience who are a little older (early 20s), the situation is much less ugly: their unemployment rate has averaged 9.3% in the past year, comparable to where it was in late 2018. These folks are much more settled into jobs than their late-teen counterparts and thus less impacted by a frigid hiring climate.
People with bachelor’s degrees in their early 20s have experienced a worse trajectory, but that’s somewhat misleading - unlike high school grads who skipped college, they’re much more likely to be starting their careers (and thus more vulnerable to weak hiring). Their unemployment rate has averaged 7.0% over the past year, comparable to the spring of 2015. But the rate of deterioration has slowed recently - this metric has only increased by 0.4 percentage points relative to a year ago; things are getting worse, but more slowly.
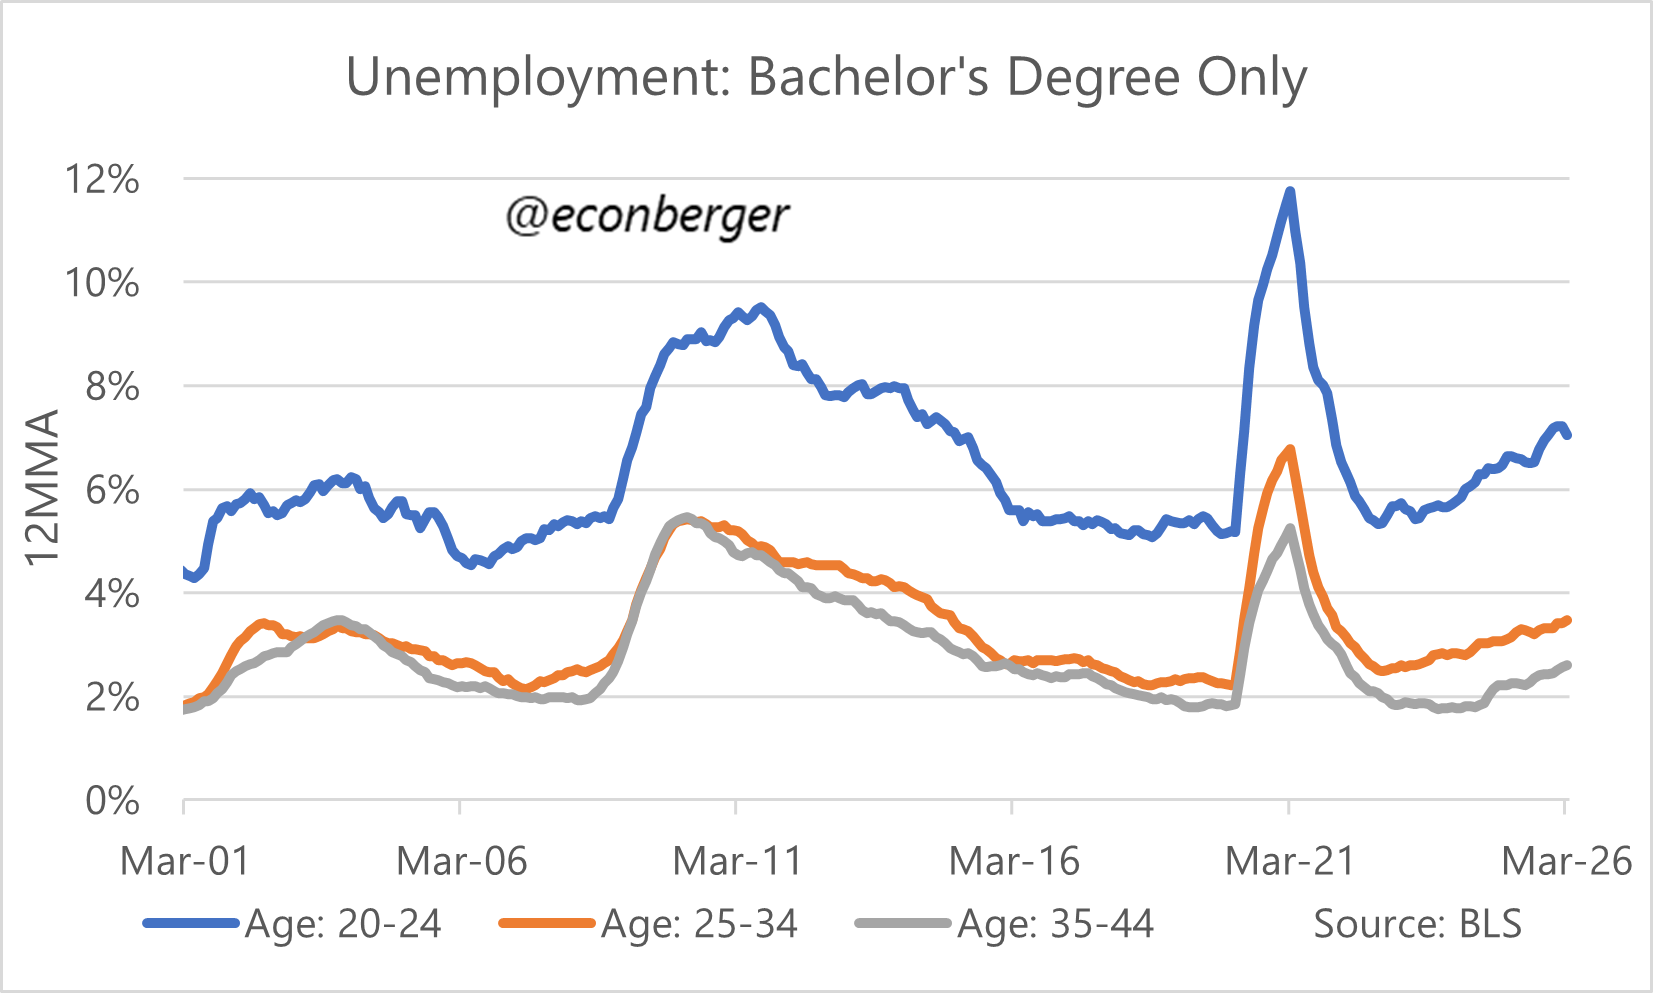
People in their early 20s with an associate degree have experienced a faster worsening in labor market outcomes than those with bachelor degrees, albeit from a much better base. Their unemployment rate has averaged 5.2% in the past year, up 0.6 percentage points relative to a year ago.
The key takeaway from these patterns is that while AI may be playing a role in increasing unemployment, a general factor affecting young people across all education levels is necessary as an explanation. And that is almost certainly just the boring old business cycle.
8. Current Population Survey Response Rates
It’s embarrassing to be wrong, but good to hold yourself accountable. I made a bad prediction a few weeks ago when I said that Current Population Survey (CPS) response rates would increase a little in March’s jobs report. Instead they plummeted, reversing February’s increase:
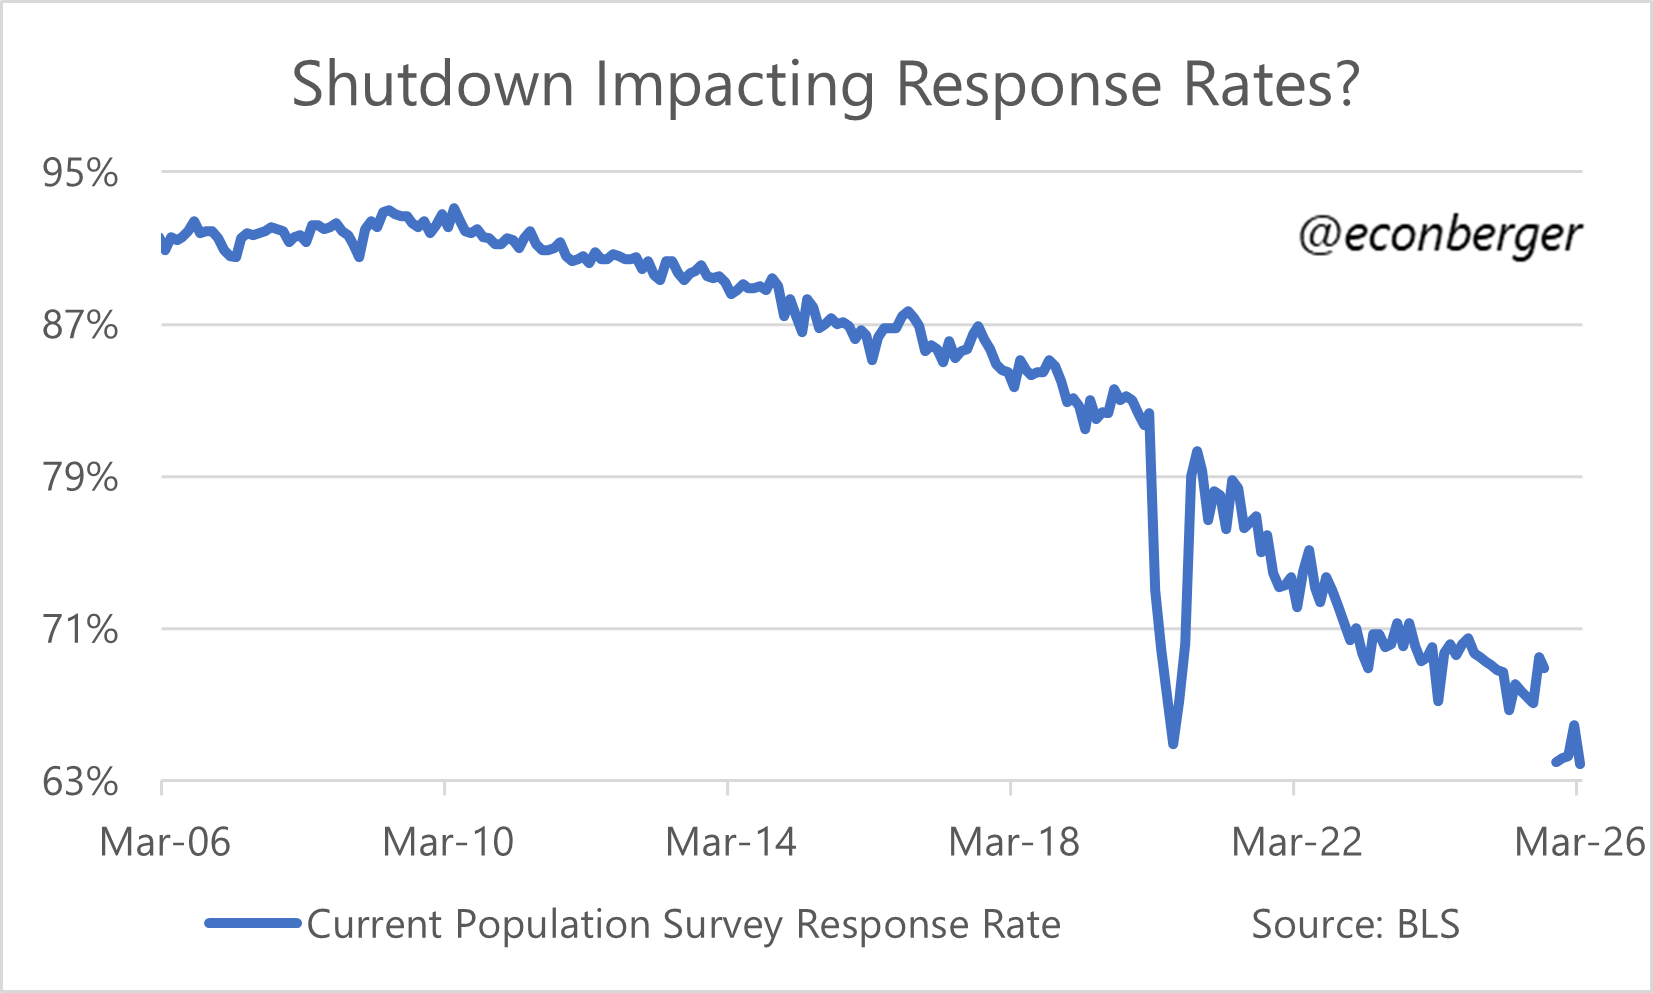
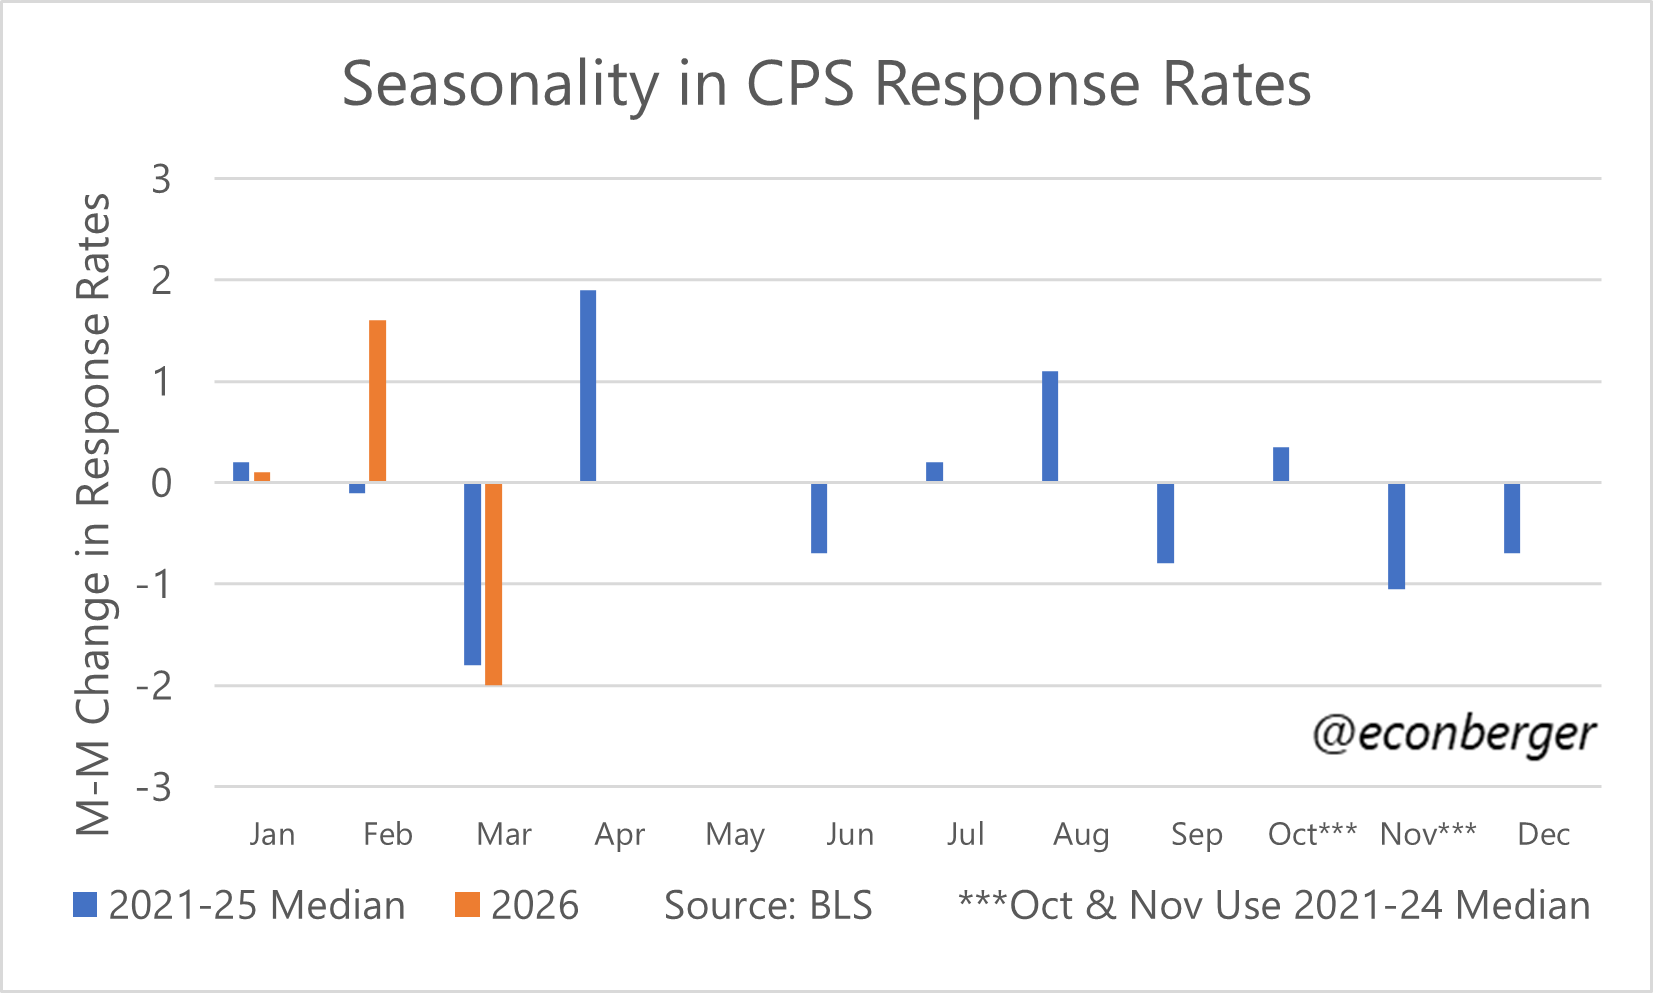
What I didn’t appreciate before wading into this topic is that CPS response rates have a strong seasonal pattern - they tend to crash in March and rise in April. I’m not sure why:
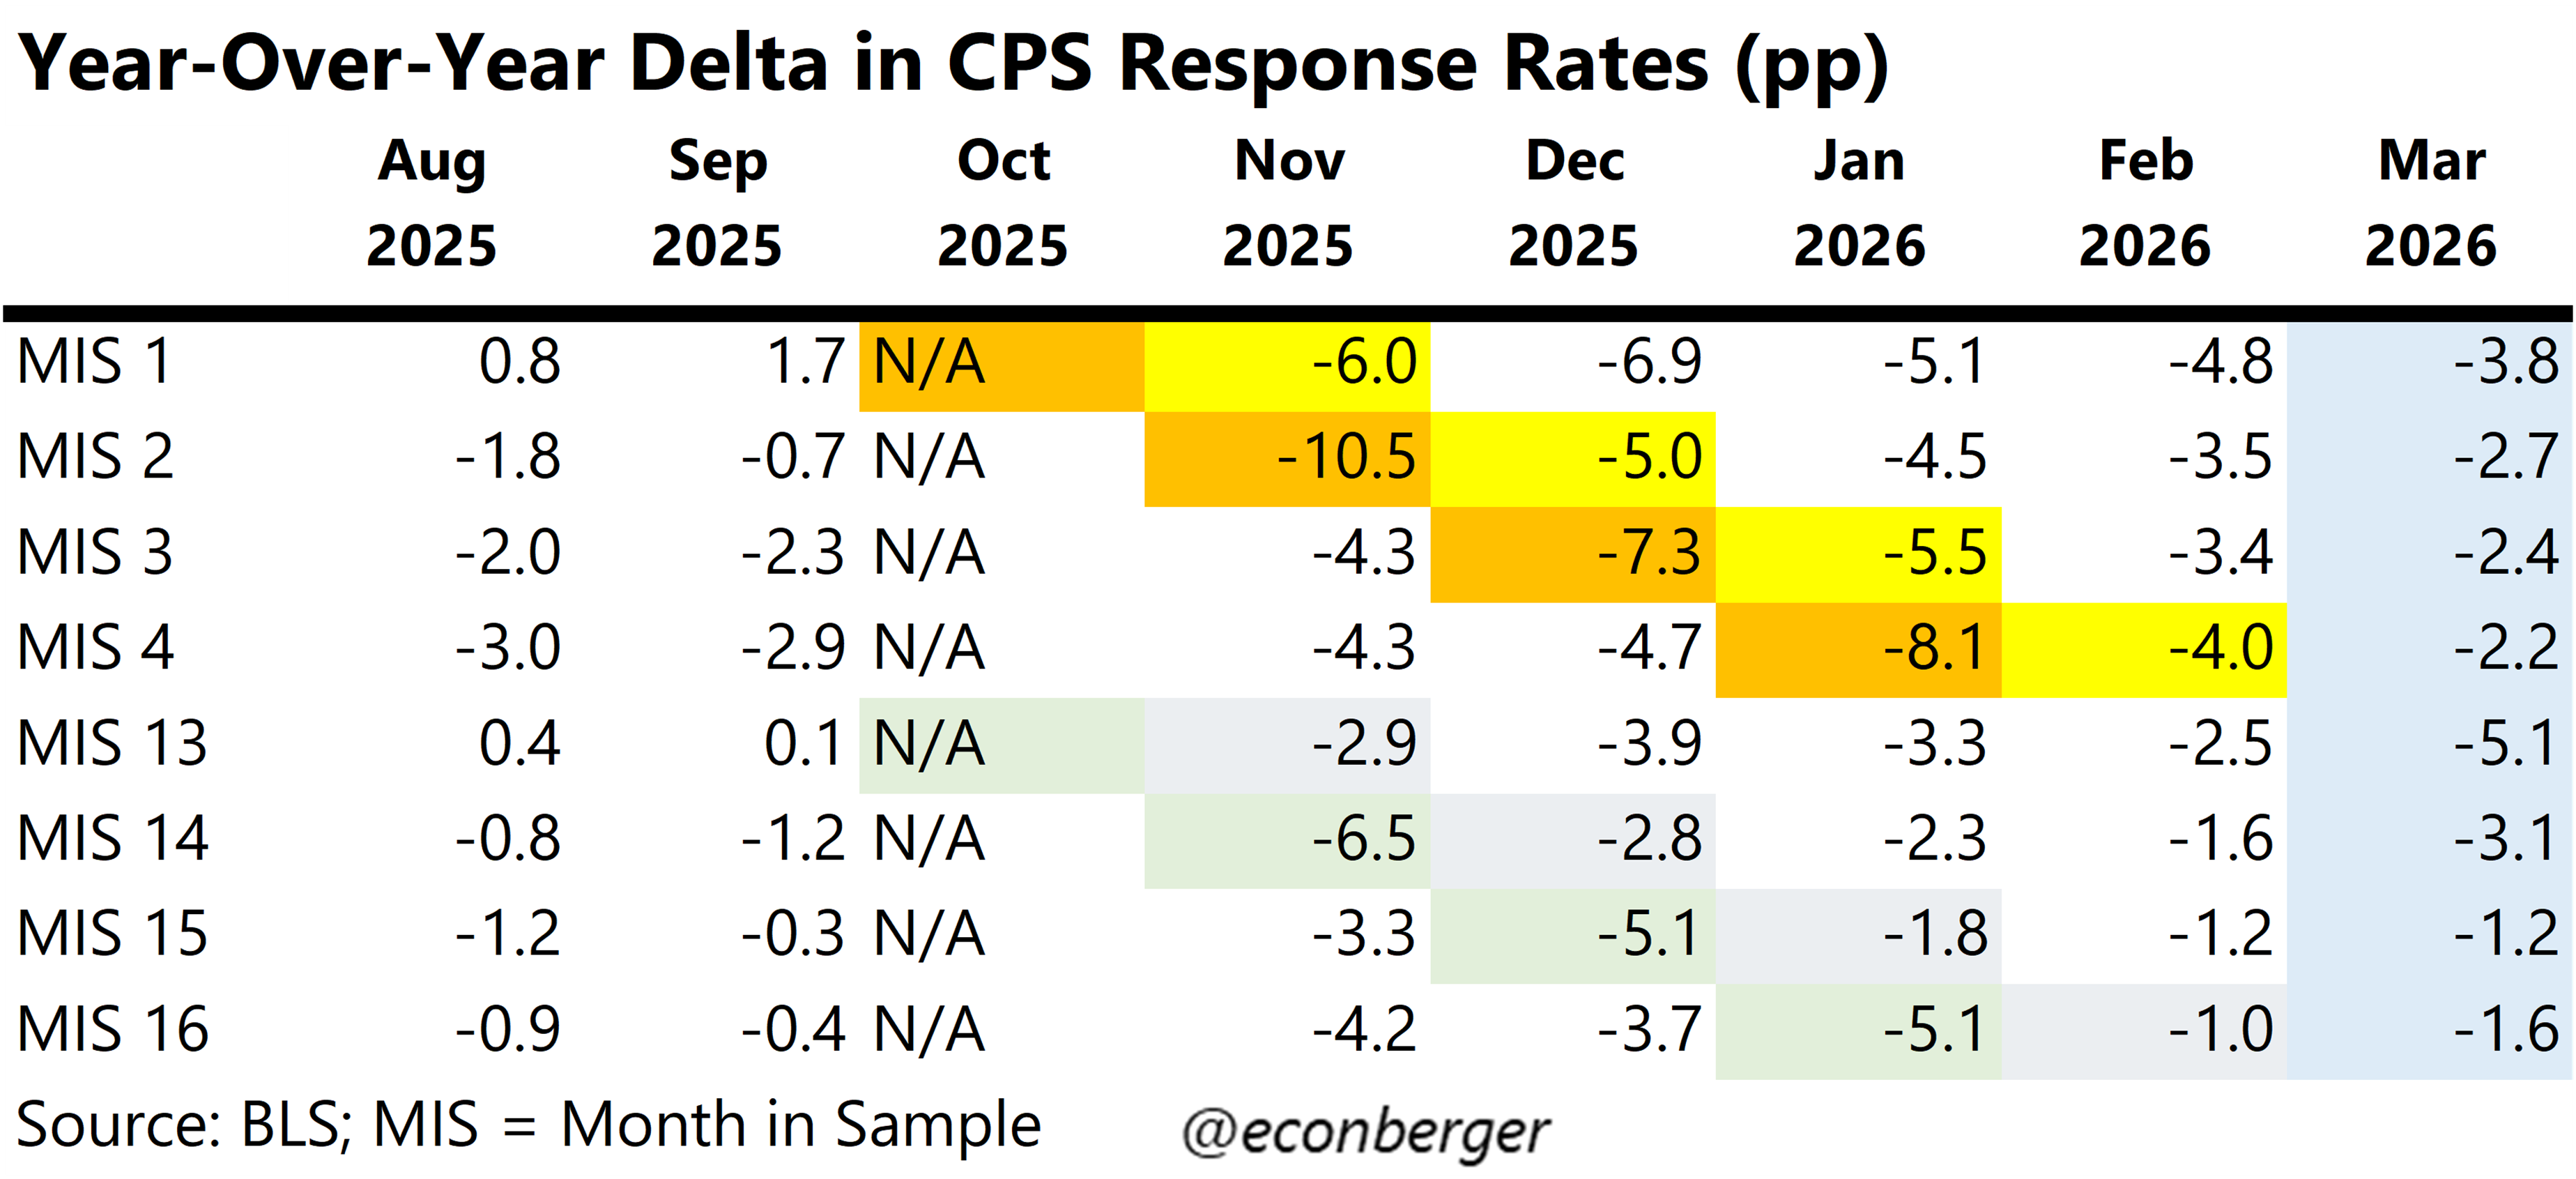
Looking at the various groups in the sample, it really does seem like the initial shock to response rates from the shutdown is fading (or has faded as far as it’s going to). But the CPS is still suffering from degraded performance among month 1 and month 2 households, and it’s harder to blame the shutdown for that - seems more likely there are durable issues with data collection.
At the risk of getting a prediction foolishly wrong again, I think April’s response rate will be a higher than March’s. But the long march downward shows no signs of stopping.
A rare exception to the “first Friday of the month” publication pattern - this is because the CPS reference period is later than usual this month (April 12th-18th) and May 1st wouldn’t provide enough turnaround time.
Hello Guy - It appears that EPOP for college grads across all age bands shows no sign of worsening. One can see that from the raw CPS files or, for example here https://x.com/ModeledBehavior/status/2018378512894136657
Have you looked into this?
I’d guess the response rate issue is spring break related. One of the few major holidays that’s long and falls evenly or even early in the month.