Happy Friday! I’ll be sending out my usual weekly monthly BLS preview on Tuesday next week, with lots of discussion of the annual revisions and population controls. Enjoy your weekend.
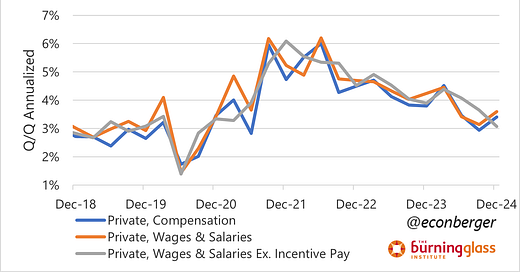
TL;DR: The Fed’s preferred measure of wage growth, the employment cost index (ECI), ran only slightly above pre-pandemic rates in Q4 2024. Given faster productivity growth, that might be “back to normal”.
More below chart.
1. Why Do We Care about the ECI?
The ECI is the Fed’s preferred measure of wage growth for one big reason: it adjusts for compositional shifts in the labor force. That gives it an advantage relative to the average hourly earnings (AHE) measure we get in the monthly jobs report - if employment growth in lower-paying jobs is higher (lower) than in higher-paying jobs, then AHE will tend to understate (overstate) wage pressures.
Another advantage of the ECI is it includes two elements of interest excluded by the AHE: state & local government employees (AHE is private sector only) and non-wage benefits. The latter is in my opinion particularly significant because workers and firms bargain over the entire compensation package; if benefit cost growth is much lower (higher) than wage growth, then wage growth will exaggerate (underestimate) inflationary pressures emerging from the labor market.
One disadvantage of ECI is that it’s mildly laggy. This is Q4 data. We’ll have more timely data from the January AHE next Friday. As always with economic data, you’re trading off timeliness versus accuracy. I’m glad we have both indicators.
2. What Did the ECI Tell Us Today?
In Q4, private sector wage & salary costs grew at an annualized 3.6%. That’s a little above the 3.0% Y/Y growth in 2019, just before the pandemic. Furthermore, labor productivity growth is currently higher than it was back then, which suggests that (to the degree you put weight on the wage growth / inflation linkage) we’re basically back to normal or even below it.
One trick I learned from Jason Furman is that it’s a good idea to strip out incentive pay from private sector wage growth. The reason is that it introduces noise into the series that for whatever reason seasonal adjustment doesn’t fully correct. And if you look at that measure, we’ve descended down to 3.1% annualized and there’s no sign of an end to that moderation.
Personally, I don’t think there’s any real information on the inflation trajectory in this data. The labor markets aren’t what’s causing inflation to be slightly elevated. (Though of course, if labor markets tank due to a recession, then both wage growth and inflation will both moderate.)
3. Government Wage Growth Still Has Room to Catch Up
Growth in state and local government wages and salaries (9.3%) has exceeded that in the private sector (8.1%) over the past 9 quarters. But that follows a period of 13 quarters when the reverse happened - the Great Resignation and tight post-pandemic labor market led private sector wages to outpace government wages (17.1% and 13.2% respective from Q4 2019 through Q3 2022). Government compensation is just slower moving in adjusting! At the current pace, the gap between the two won’t “normalize” until 2030.
4. Wages Are Outpacing Benefit Costs
This isn’t anything new, but for more than a decade, wage growth has outpaced benefit cost growth. (One implication: wages overstate compensation cost pressures.) I think this is interesting because it’s a complete flip of what we saw in the 2000s and early 2010s, when a lot of the comp cost pressure was coming from the non-wage benefit side. I’m not sure what the explanation is - my first speculative guess is the Affordable Care Act implementation in 2014, but not sure that would survive scrutiny.


