


BLS Jobs Report Recap (May)
Still Cooling (Probably)

TL;DR: A solid jobs report, but the labor market is probably still cooling.
Key Data Points:
Unemployment rate: rose to 4.0% (eh)
Prime working age employment population ratio: unchanged at 80.8% (not bad)
Nonfarm payroll employment: rose by 272K (very strong)
Wage growth: ~4.0% annualized over the past 3 months (ok from the Fed’s perspective)
Topics I’ll cover in this recap:
The Big Picture
Dismantling Bad Takes
Miscellaneous


1. The Big Picture
Two things are simultaneously true at present:
We’re adding a lot of jobs each month
Supply is growing sufficiently fast to have mildly loosened the labor market, a process that is probably still ongoing
We’re not used to this mix of data, but it used to be a lot more common when the US population baseline growth was higher. Between January of 1970 and January of 1980, US nonfarm employment increased by 27.5% - today, that would be equivalent to 325,000 jobs per month. Employment grew, by a lot, but not enough to keep up with labor supply.
There’s good evidence that, on a smaller scale, something similar is happening today. We’ve averaged job gains of 230,000 per month over the past year, even as the unemployment rate has risen by 0.3 percentage points. A lot of discourse has centered around probable downward revisions to the nonfarm payroll gains, but even if revisions are large, those numbers will remain comfortably solid. The debate about revisions is mostly a sideshow to entertain/aggravate labor data nerds.
Another way of thinking about it: let’s say, contrary to expectations, the next round of annual employment revisions are positive; we’ll still be looking at a small increase in the unemployment rate, indicating a mild cooling in the labor market. And to pick a diametrically outlandish counter-scenario, imagine that downward revisions are large enough to put negative signs in front of all those payroll numbers; we’ll still be looking at a small increase in the unemployment rate and a mild, non-recessionary cooling in the labor market.
For what it’s worth, this has me shying away from job report descriptors like “hot”. Even if job gains are strong, the unemployment rate has gone up (a little).
“How long this can go on?” Historically small increases in the unemployment rate tend to evolve into large ones via recession. But none of the dynamics for that turn appear to be in place at the moment. A prediction of “we’ll keep adding a lot of jobs and the unemployment rate will go up by another 0.3 percentage points” seems as good as any.
2. Dismantling Bad Takes
I made a quip today that “if you’re reading negative takes about today’s jobs report, they’re probably wrong”. This isn’t literally true - there were a few corners of the job report that looked soft.
But two takes that were definitely bad: immigration and part-time work.
On immigration, native-born employment has fallen by 299,000 over the past year and immigrant employment has risen by 637,000. This has led to some erroneous but predictable complaints that “immigrants are taking all the jobs; the job market sucks for native-born Americans”.
What these complaints miss is the merciless context of demographics. The prime working age native born population of the United States peaked more than 17 years ago. Over the same period, the prime working age immigrant population has grown by more than 6 million. Over the past year, the deltas have been 614,000 (immigrant) and 88,000 (native born). That explains the lion’s share of the employment growth differential

If you look at unemployment rates, these have gone up a little for both groups over the past year. But the increase is larger for immigrants than for the native-born.

The other source of bad takes is part time work. In May, the number of Americans working part-time hours increased by 359,000 even as the number of Americans working full-time hours decreased by 49,000. That sounds bad, right?
Well… setting aside the noise of these monthly numbers, which is substantial, it’s always useful to split people working part-time into those working part-time for economic reasons (because they can’t find full-time hours) and those working part-time for non-economic reasons (family, school, health, etc). The “for economic reasons” group is the one that’s of interest - there are more of these folks when the labor market is bad, and fewer when it’s good. And their number fell very slightly in May, though it’s up a little over the past year or so - consistent with other data in the report suggesting a mild cooling in the labor market.

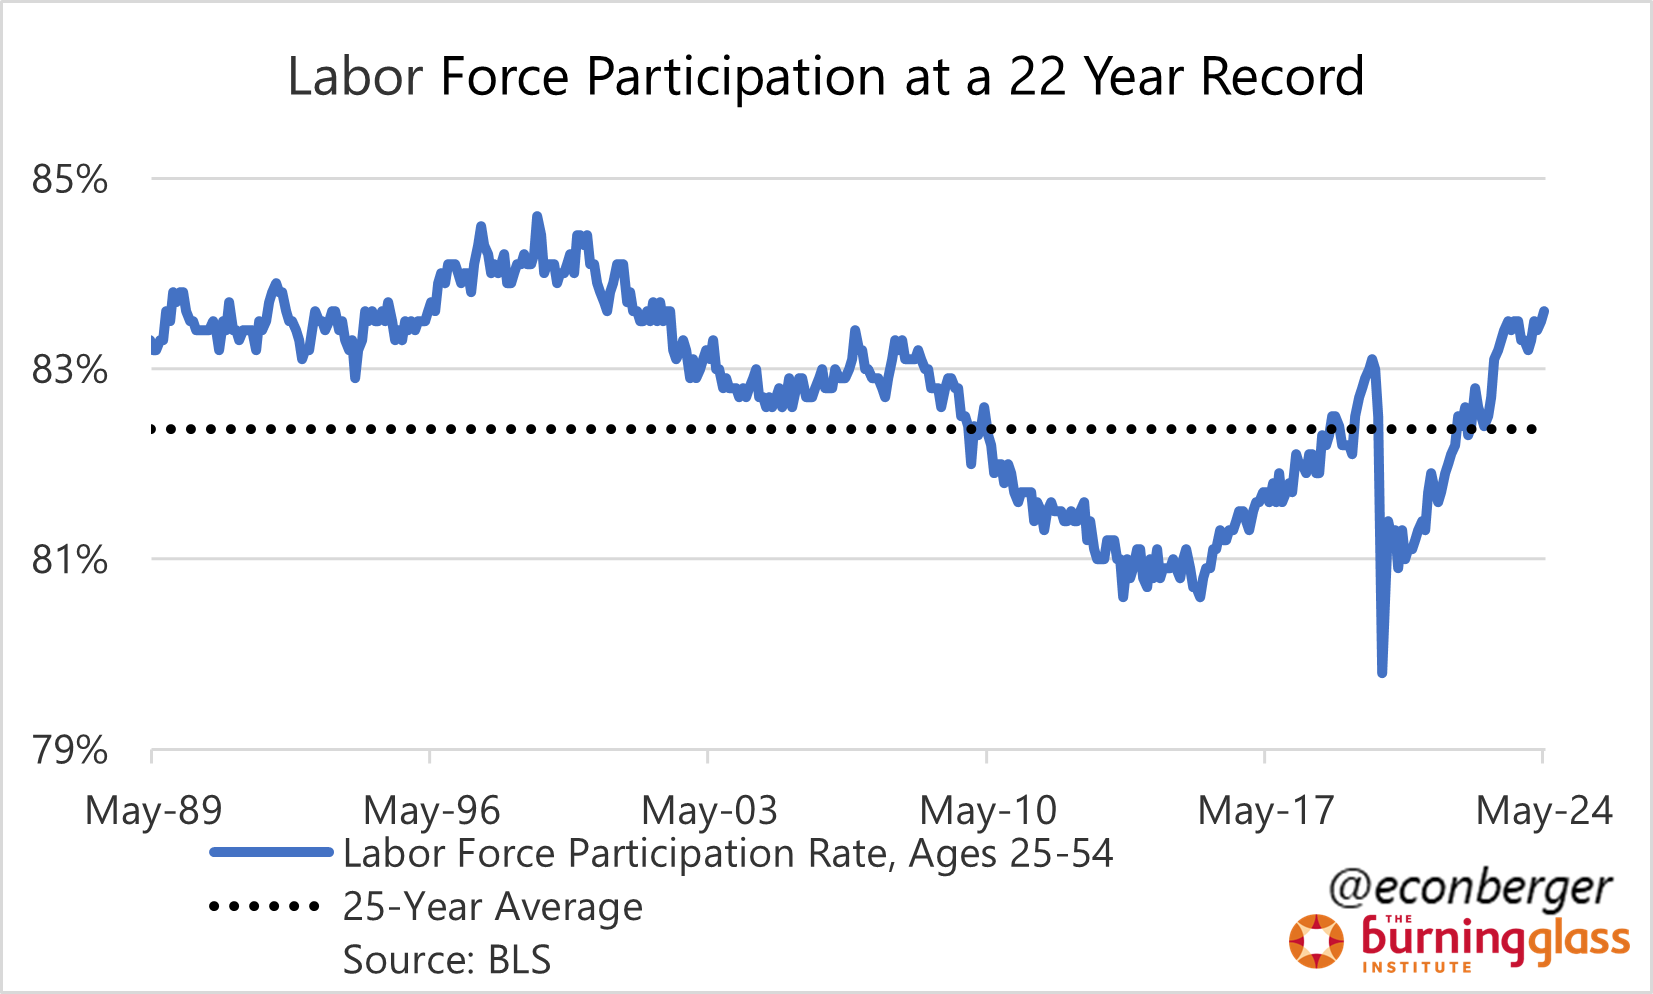
Another bad take I saw today was about falling labor force participation. This reflects (mostly) demographics! The Baby Boomers are retiring. Prime working age labor force participation actually rose in May to its highest level in 22 years.
One negative take that has more reality-based traction is the unemployment rate for black Americans. Last year we reached an all-time low on the gap between black and white unemployment as a hot labor market lifted all boats. But the mild cooling of the labor market over the past year has, as often in the past, disproportionately harmed workers of color.

3. Miscellaneous
Wage growth looked really low - even lower than pre-pandemic trends - last month. There was a rebound in May, and on a 3-month basis it’s around 4.0%-4.1% annualized. 6 months ago that range was 3.8%-4.6%, and 12 months ago it was at 4.8%-5.3%. So we’ve definitely seen deceleration, though it’s less clear whether deceleration is ongoing.
Regardless, this isn’t that much higher than the pre-pandemic average, and there may be room to run higher given productivity growth. Either way, I tend to be pretty agnostic about the linkage between wage growth and inflation; if inflation data cooperates, then it won’t matter if wage growth remains elevated, and if inflation data remains uncooperatively high, it won’t matter if wage growth delerates.

The other bit of data I want to talk about is Generation Z labor market outcomes. There were big spikes in the unemployment rates for teenagers and early-20-somethings that generated some chatter and probably represent noise in small CPS subsamples.
But the overall behavior of these two groups since the pandemic is quite interesting! Teenager employment has boomed - it’s now the highest since the mid-2000s. Meanwhile, employment for early-20-somethings, on the other hand, has trailed the other two groups and failed to make a full recovery. I don’t have an explanation - post-secondary education may be part of it if the enrollment data confirms it (I haven’t looked).
