BLS Jobs Report Recap (June)
A Surprising Batch of Good News
TL;DR: This was a good jobs report, indicating a resilient and steady labor market despite policy headwinds. I don’t know how much longer that resilience can last.
Key Stats:
Unemployment Rate: Fell to 4.12%, its lowest level since January (Good)
Nonfarm Payroll Employment: Increased at an above-breakeven rate of 147K (though likely to be revised down in the future) (Good)
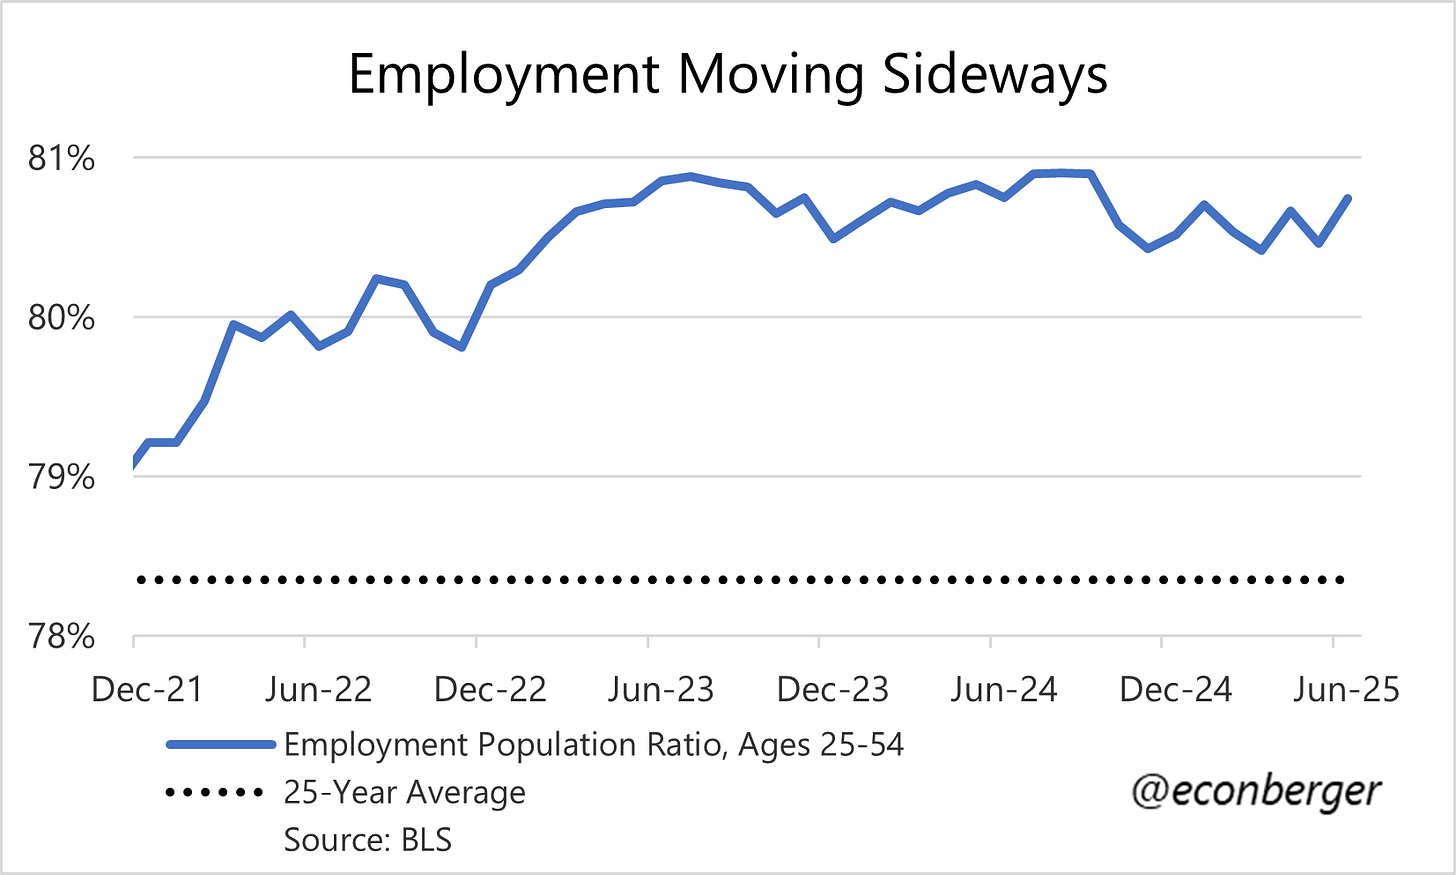
Prime working age employment population ratio: rose to 80.7% (Good)
The rest of this recap is split into the following sections:
The Big Picture
A Falling Breakeven Rate
Quibbles
A Weak Job Market for Youngsters, but AI Is Not to Blame
More below charts.
1. The Big Picture
This was a good jobs report. I wouldn’t go far as “great”; this is a job market that’s holding steady, not one that is reheating. But given pessimistic expectations about its trajectory (including by yours truly), the data was almost uniformly a pleasant surprise.
There are several plausible interpretations for this resilience. The one I subscribe to (weakly) is that just because renewed cooling hasn’t shown up in this data doesn’t mean it’s not coming. The headwinds of restrictive monetary and fiscal policy are still there, gradually constricting economic activity and the labor market.
A related observation is that our highest quality indicator of recent labor market cooling – continuing claims for unemployment insurance – has so far just registered a modest worsening. Even had the BLS data matched it, the implied deterioration in indicators like the unemployment rate would be small.
Another possibility is that we’re overly focused on headwinds to the demand side of the labor market and underestimating the supply side. Immigration flows have slowed sharply (more on this later in the recap). I don’t fall into this camp (at least not yet), but it’s not inconceivable that the labor supply squeeze is fully (or more than fully) offsetting its labor demand counterpart. In this scenario, renewed labor market loosening will not happen any time soon (or at all). Strong versions of this thesis might even anticipate the labor market heating up again.
We’re just going to have to wait this out a little while longer – I doubt that the BLS jobs report and unemployment insurance data can remain in tension much longer.
2. A Falling Breakeven Rate
I wrote about this in my preview, but it’s such an important point that I’ll reiterate it (and not for the last time): the slowdown in employment growth relative to 1-2 years ago tells us more about the supply side of the labor market than about the demand side. The breakeven rate of employment growth – the number of jobs the economy “needs” each month in order to hold employment and unemployment steady – has fallen and is much lower than in the past. Numbers that would have previously been considered mediocre or even weak are now decent, and numbers that would have previously been considered decent are now good or even great.
Comparing the first six months of 2024 and 2025 is instructive: Nonfarm payroll employment (as currently reported) grew by 164K in H1 ’24 but only 130K in H1 ’25. If you take probable future revisions into account, those numbers are probably more like 132K and 65K. A naïve and erroneous characterization would be that the labor market was weaker recently than a year earlier. But the unemployment rate increased by 0.3 percentage points in the earlier period, and was unchanged in the latter. The naïve interpretation is led astray by slowing labor supply growth.
I’d also observe that the likelihood of future large negative revisions to recent data does not change this conclusion. Revisions mean employment growth is slower than currently published numbers, but also that the breakeven growth of employment is lower than suggested by those numbers.
3. Quibbles
Even a good jobs report will have a few soft spots. There aren’t a lot of them in this one, but I do want to address a few that I’ve seen cited.
A. Government Employment
73K, roughly half of the increase in nonfarm payroll employment during June, came from the government. This was the biggest monthly increase in government employment since March 2024. Moreover, the federal government shed 7K workers during June; the increase mostly came from education-industry employees of state governments (+40K) and local governments (+23K).
This large increase probably reflects seasonal adjustment quirks like the school-year-end timing, and I wouldn’t expect it to be sustained – we might even see payback next month. If so, next month’s report will be a little weaker than this one was. That said, the numbers involved here are small, lowering the unemployment rate by a few hundreds of a percentage point at most. If we naively assume an alternate world where all 63K teachers would have been unemployed, the unemployed rate would have been 4.15% instead of 4.12%.
B. Discouraged Workers
The BLS’s definition of unemployment includes the subset of jobless people who are either actively searching for work, or expecting recall after a temporary layoff. But people want a job despite not actively looking, and the BLS thus also tracks “the marginally attached” – people who say they want a job right now, but and have searched for work in the past year (but not in the past month). A minority of these workers are characterized as “discouraged” – they are marginally attached, AND indicate the reason they aren’t currently looking is because there are no jobs for them.
In June, there was a big spike in the number of marginally attached workers to 654K, the highest level since December 2020 (when the job market was in much worse shape). How worried should we be?
It’s a good rule of thumb that big month-to-month movements in the Current Population Survey (where this data comes from) usually reflect noise. In other words, I wouldn’t take this specific number literally.
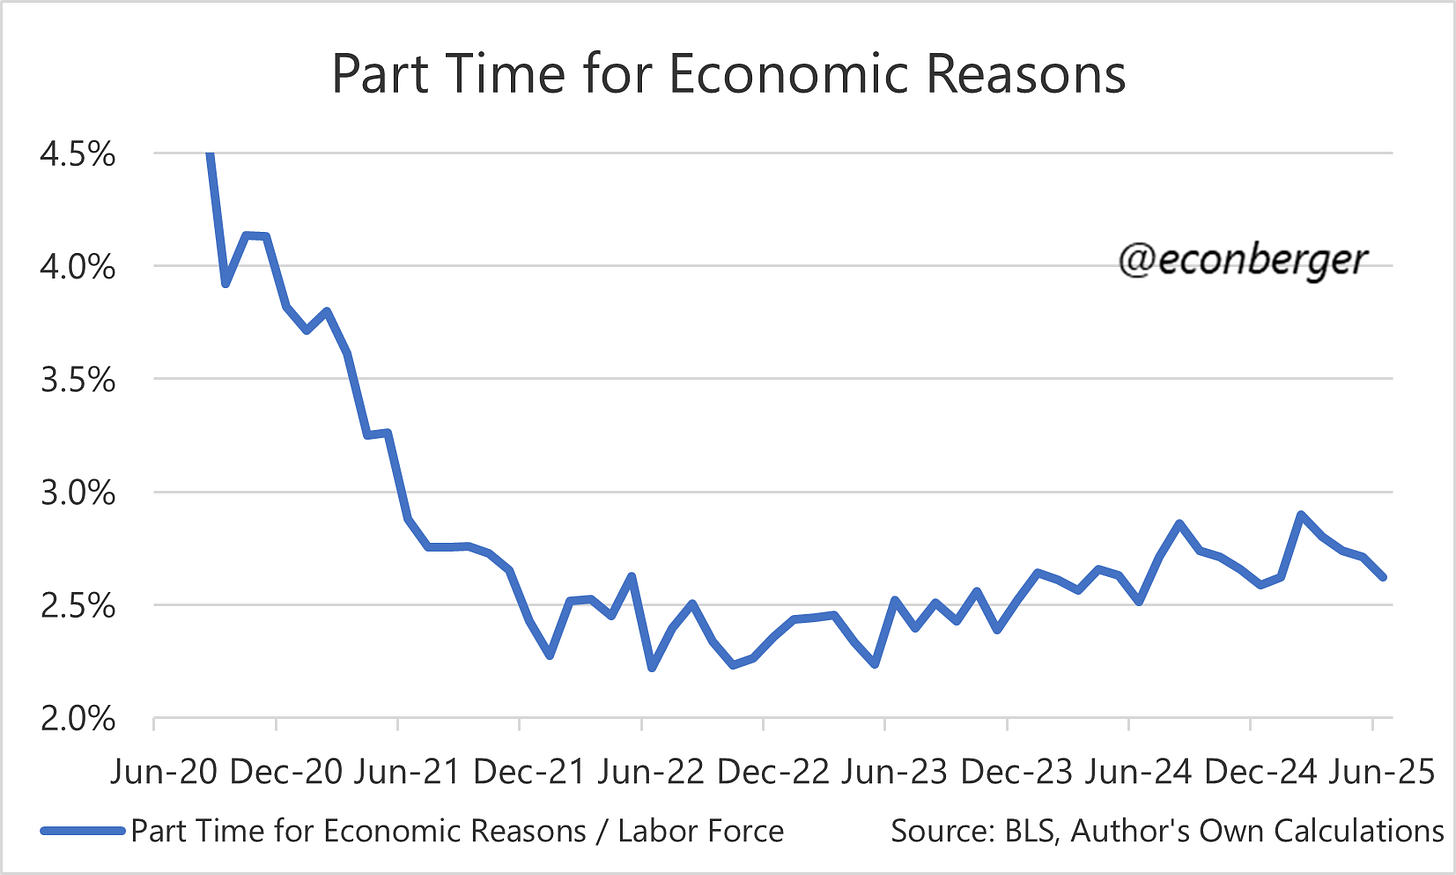
That said, the number of discouraged workers has been rising over the past two years, tracking other indicators of labor market softening like the unemployment rate and share of folks working part time for economic reasons. I’d characterize this month’s change as “mostly exaggerated noise but also reflective of a medium run weakening in the labor market”.
C. Hours and Earnings
The Current Employment Statistics (CES) survey that generates the nonfarm payroll employment count also offers data on average hours worked and average hourly earnings (wages). Average weekly hours were on the soft side, and wage growth has decelerated consistently below the 4% threshold that Fed Chair Powell has periodically cited in the past.
I’m not sure what to make of these. The average workweek can be a leading indicator for headcount, so maybe we’re getting an early warning sign of worse news ahead. On the other hand, I’d expect to see more of an increase in the share of people working part time for economic reasons as corroborating evidence, and that isn’t really visible.
As far as moderating wage growth, I’m inclined to think it’s a lagged reaction to the prior wave of labor market cooling. But the timing is a little odd given stabilizing apparent in most other labor market data.
4. A Weak Job Market for Youngsters, but AI Is Not to Blame
This is a challenging job market for younger workers. In a low hiring, low firing labor market, people who need jobs (these tend to be younger) are going to be hit harder than people who already have them (these tend to be older). But while I’m a big fan of science fiction, I’ll once again throw cold water on the argument that AI is a major driver.
While the news headlines are dominated by how hard it is for recent college grads to find work, the fact that recent high school grads are also struggling. And while improvements in AI may eventually affect roles that hire these grads the same way that it’s (starting to) impact white collar office work, right now it’s not a plausible explanation for their troubles.
Until recently, youngsters with associate degrees have been relatively immune to these troubles, unlike their more- and less-educated peers. My guess is this partial immunity was due to a pair of factors: associate degrees never experienced the same surge in supply seen with bachelor’s degree; and the mix of industries in which they are more prevalent has experienced stronger employment growth. Nevertheless, their unemployment rates have recently taken a turn for the worse.
Finally, unemployment rates for young grads with bachelor’s degrees ironically seem to be… stabilizing? Their lot is still quite bad by the standards of the past decade, but doesn’t seem to be getting worse. It’s a thin reed of hope, but might be sustainable if we keep getting jobs reports like June’s.


