High Frequency Labor Market Indicators (10/17)
Claims, Morning Consult
Note: While the shutdown is ongoing, I’m going to move this weekly post to Friday (when the claims data is available.
TL;DR: The data from unemployment insurance and Morning Consult generally looks OK (i.e. no precipitous deterioration in the labor market yet) with some pockets of weakness.
This post includes:
What’s Next
An Update on the Shutdown
Claims for Unemployment Insurance
Morning Consult Unemployment Rate
What I’m Reading
More below chart.
1. What’s Next
We will probably get more claims data out of the Department of Labor next week I’m crossing my fingers. We’ll also get more weekly data out of Morning Consult, I think.
Looking further ahead, we get the Chicago Fed Nowcast on October 27th (sorry, last week I was wrong about the date), Conference Board labor market differential on October 28th and ADP on November 5th. I’m guessing a new set of Revelio data will come out around the 5th too.
At some point the government will reopen and we’ll get the September BLS jobs data as well. (Unfortunately, the odds of October data not being collected has gone up significantly.)
Also, I plan to write about a few other indicators I haven’t covered in this report, including Indeed’s job opening data and the Homebase data (though I’m sorry… I didn’t do it this week). Stay tuned.
2. An Update on the Shutdown
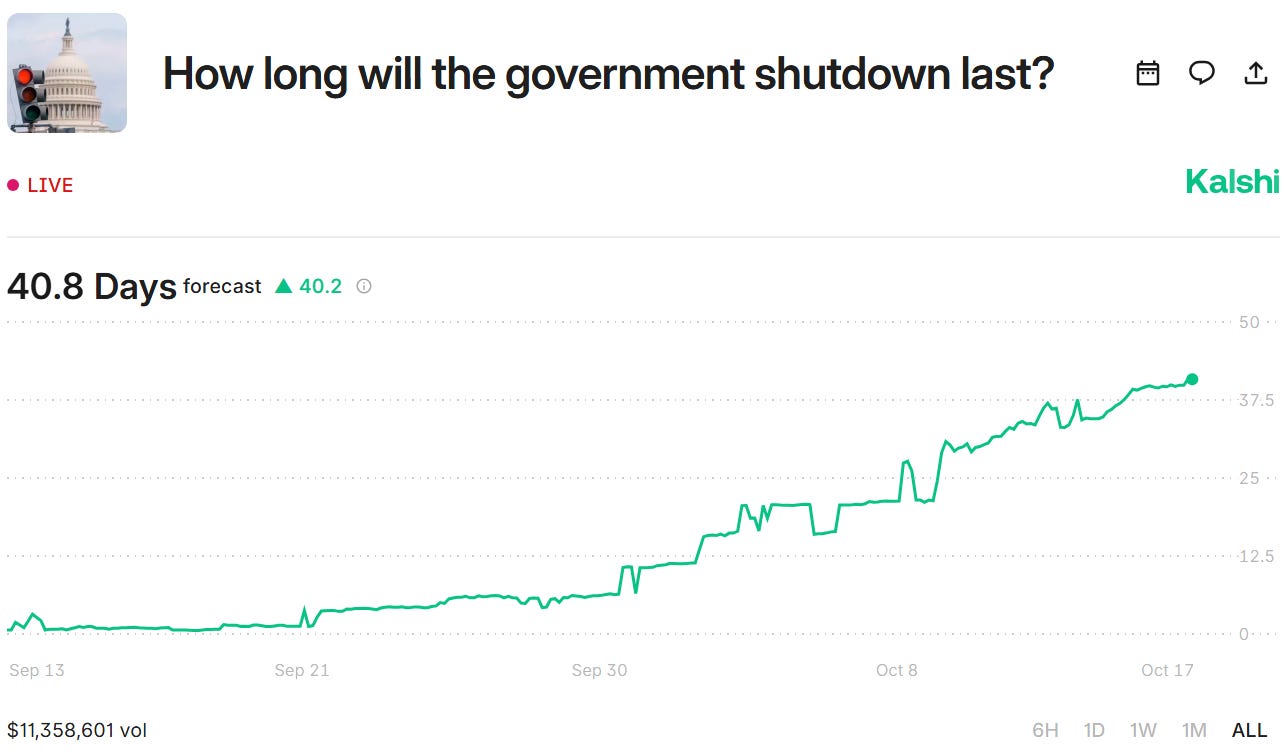
8 days ago the Kalshi forecast for shutdown duration was 26 days (late October). It’s now 41 days (mid November), so people have become considerably more pessimistic. The contract for more than 60 days (November 30th) is now trading at 20%.
Conventional wisdom is that shutdowns don’t cause lasting damage to the US economy. But the longest shutdown on record is just 35 days long. A few weeks ago I wrote:
If the shutdown goes on long enough, the probability of irreversible damage increases. …prior shutdowns’ aftermath made most recipients of government money whole. But people have to bide their time until that happens, and if there’s a long lag parts of the economy can break.
People have to pay mortgages and keep businesses afloat. That’s hard to do over long periods of time when no income is coming in. I don’t know how long that takes but I hope we don’t find out.
3. Claims for Unemployment Insurance
The Department of Labor is still compiling the unemployment insurance data despite suspending publication of the weekly claims report. I hope this continues because even under normal circumstances this is a great indicator; in the present situation it’s one of the best we’ve got.
The gist is that the data looks OK, neither great nor terrible. There are pockets of weakness that I expect will intensify, mostly on the initial claims side, but they’re pretty small so far. It’s worth mentioning that, in tandem with the shutdown, we’ve probably hit the expiration period for the federal workforce buyouts and we’re seeing involuntary layoffs (both from past RIFs, and from the new ones being announced). The shutdown effects could reverse quickly (if it ends on a reasonable timeline) but the federal workforce reductions will not.
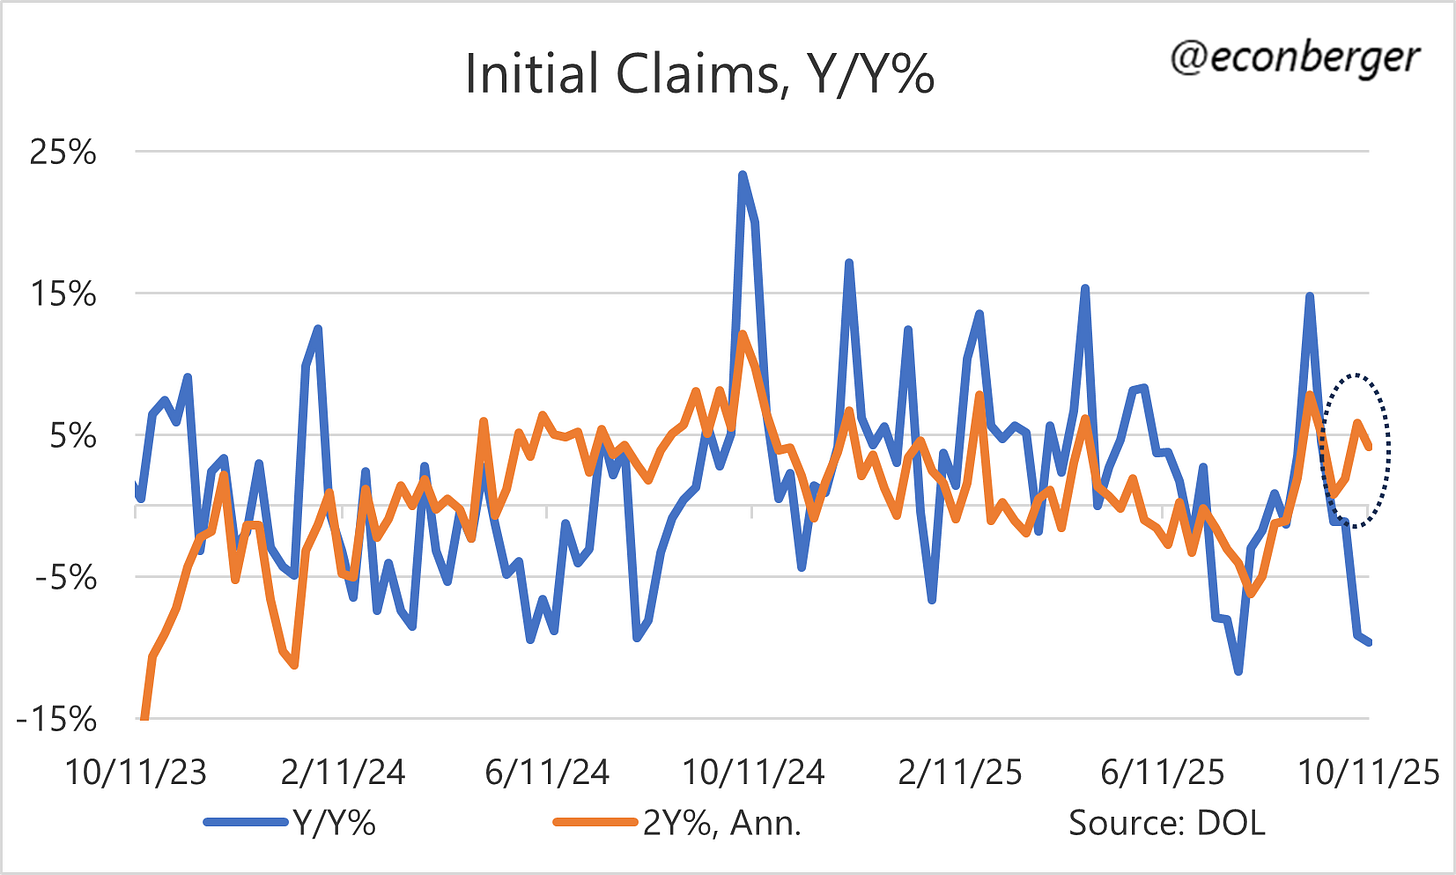
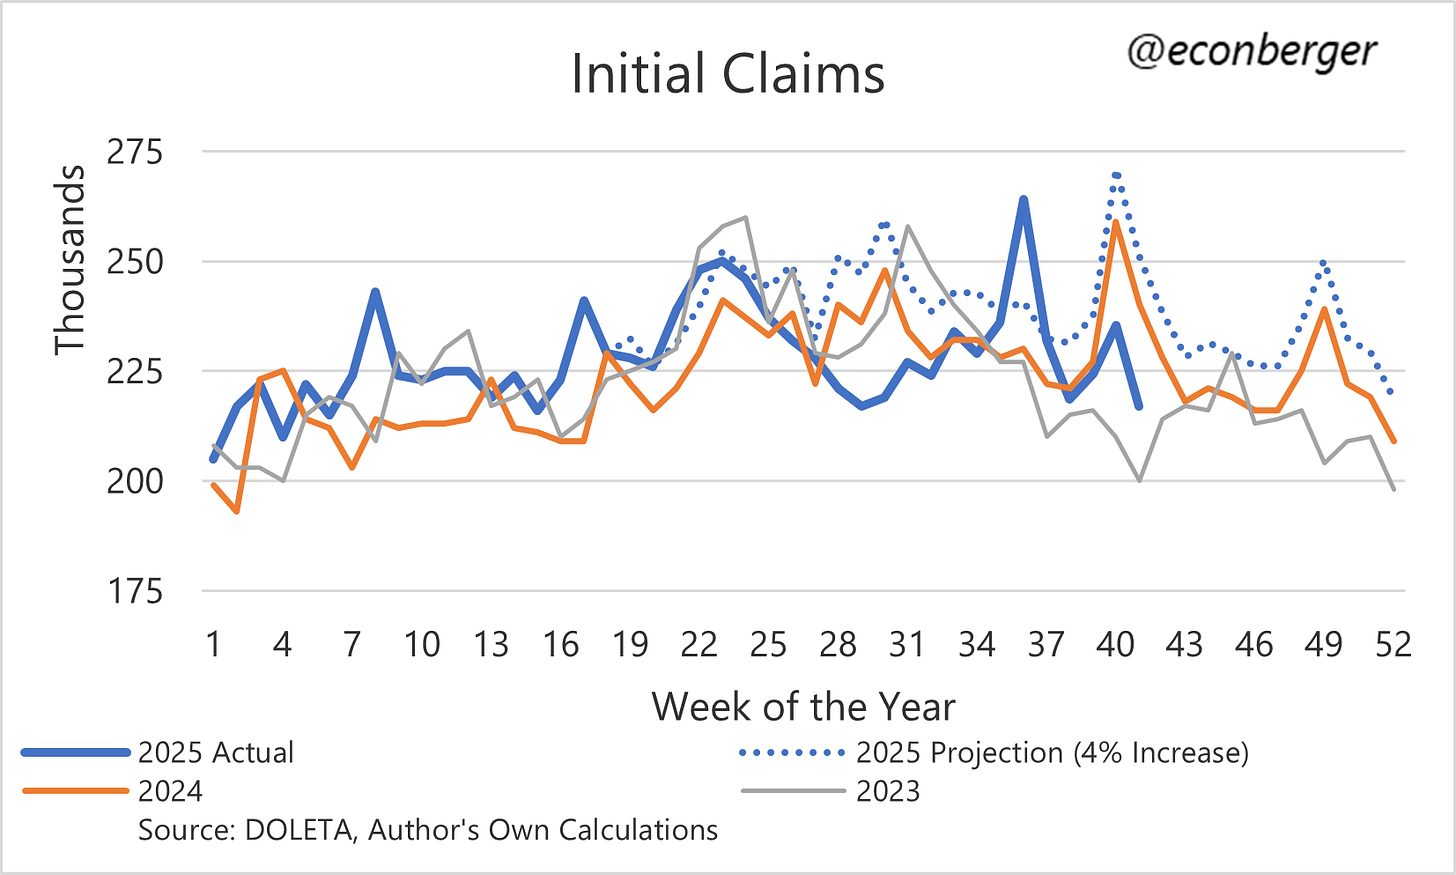
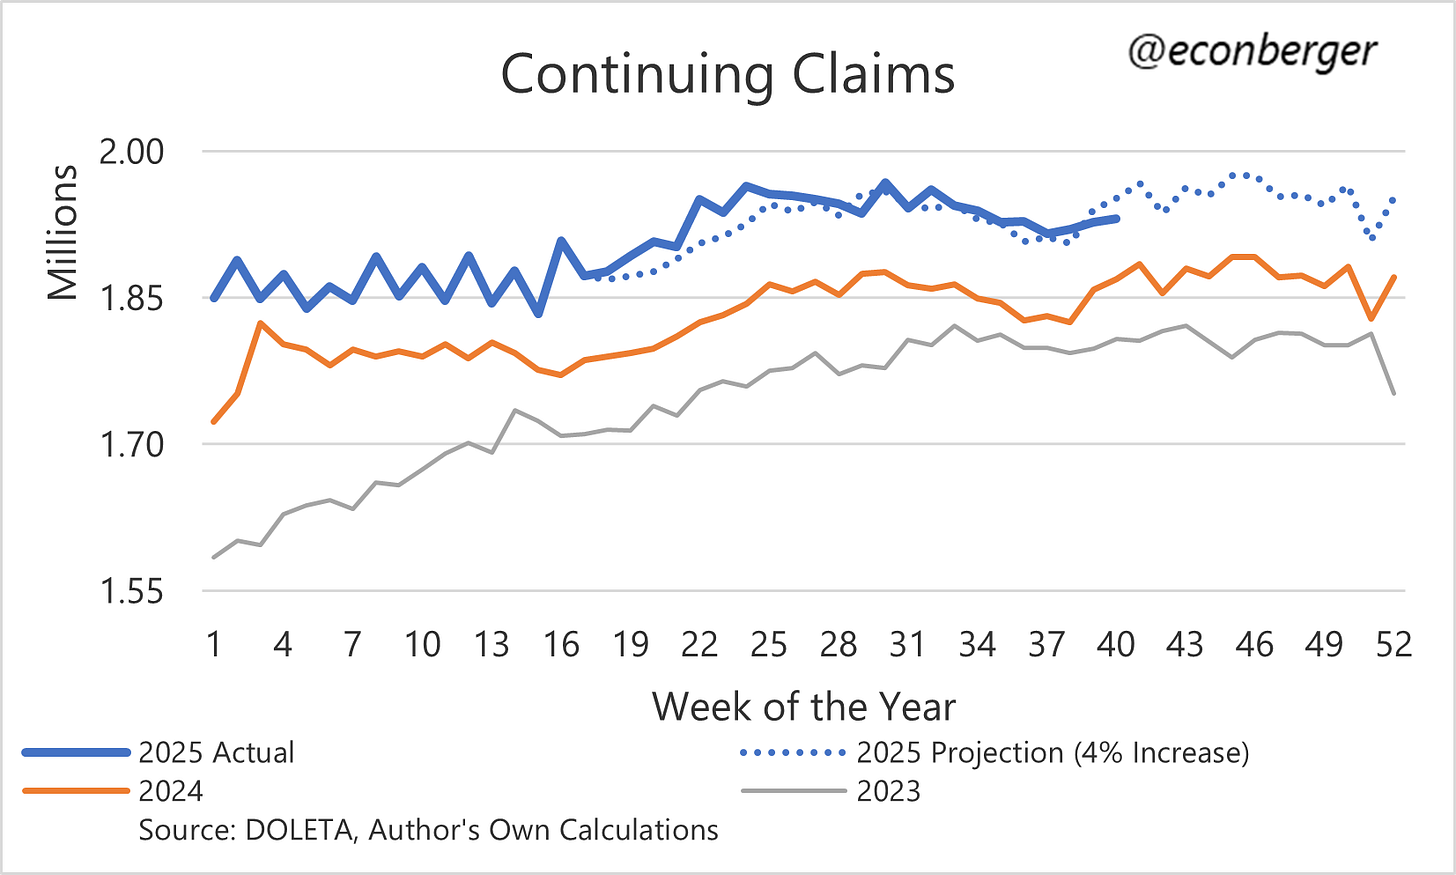
Starting with the non-federal-worker initial claims, they’re below 2024 levels but above 2023 levels. 2024 has a big base effect due to Hurricane Helene (and Milton?) that I think we should discount, so 2023 is probably a better comparison…
…And that makes me a little worried about the trajectory. We now have 2 weeks of post-shutdown data. Both of those show initial claims running a small bit on the high side. I don’t want to get carried away here: it could be noise, it’s small, the shutdown could end soon. But I don’t like seeing it.
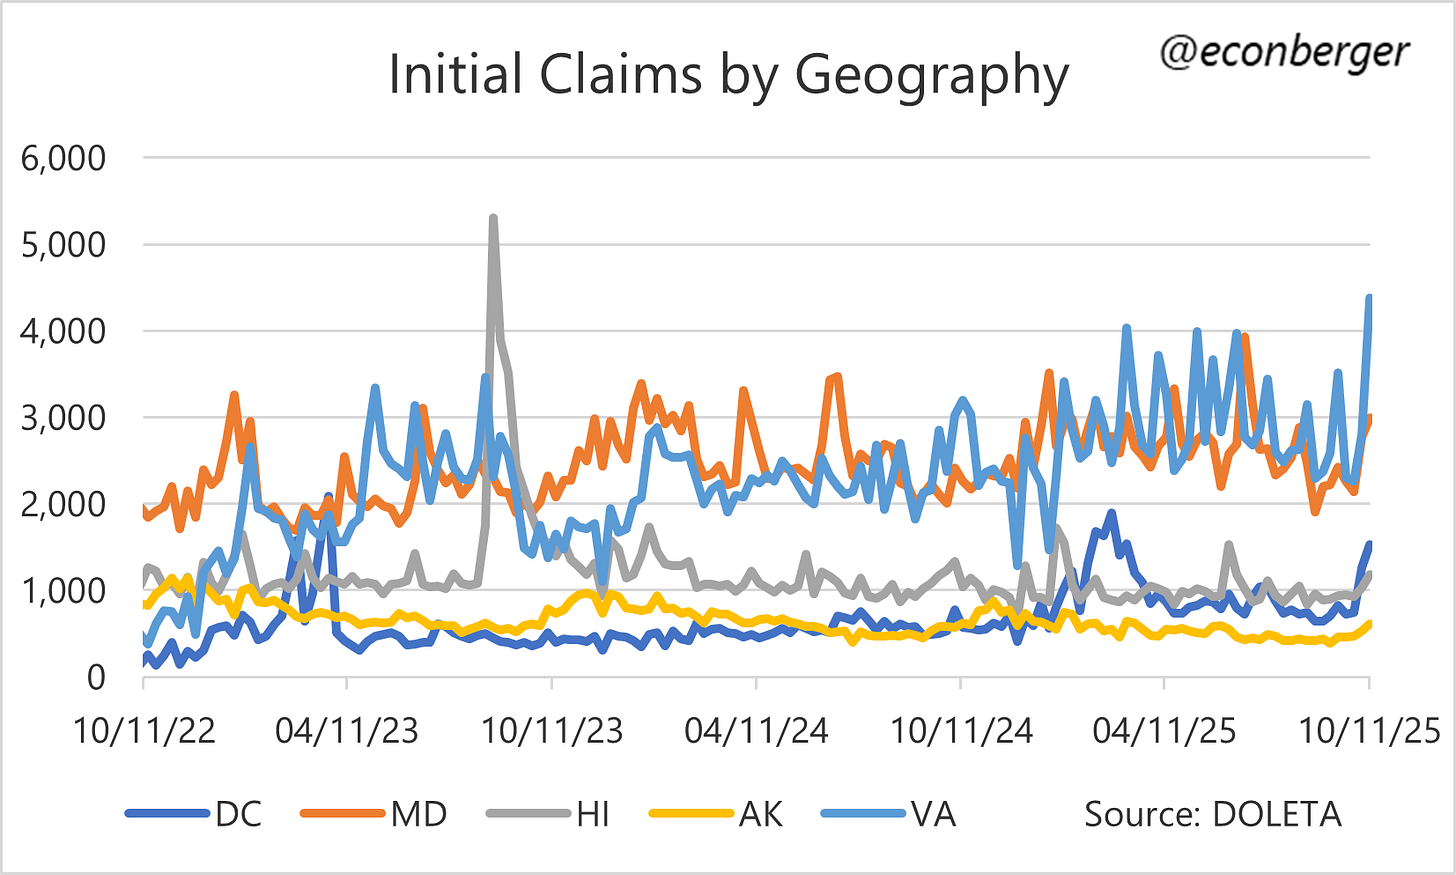
Before I turn to federal workers, I think it’s worth thinking about the mechanism that’s causing non-federal-employee initial claims to go up. One channel is the suspension of payments to private-sector contractors for the federal government. Another channel is the suspension of some transfer payments (which reduce recipients’ spending power). And a third channel is the suspension of paychecks to federal government employees (who also reduce spending power). In general, I’d expect these effects to be geographically concentrated in geographies with the highest representation of federal government workers: DC, VA, MD, HI and AK.
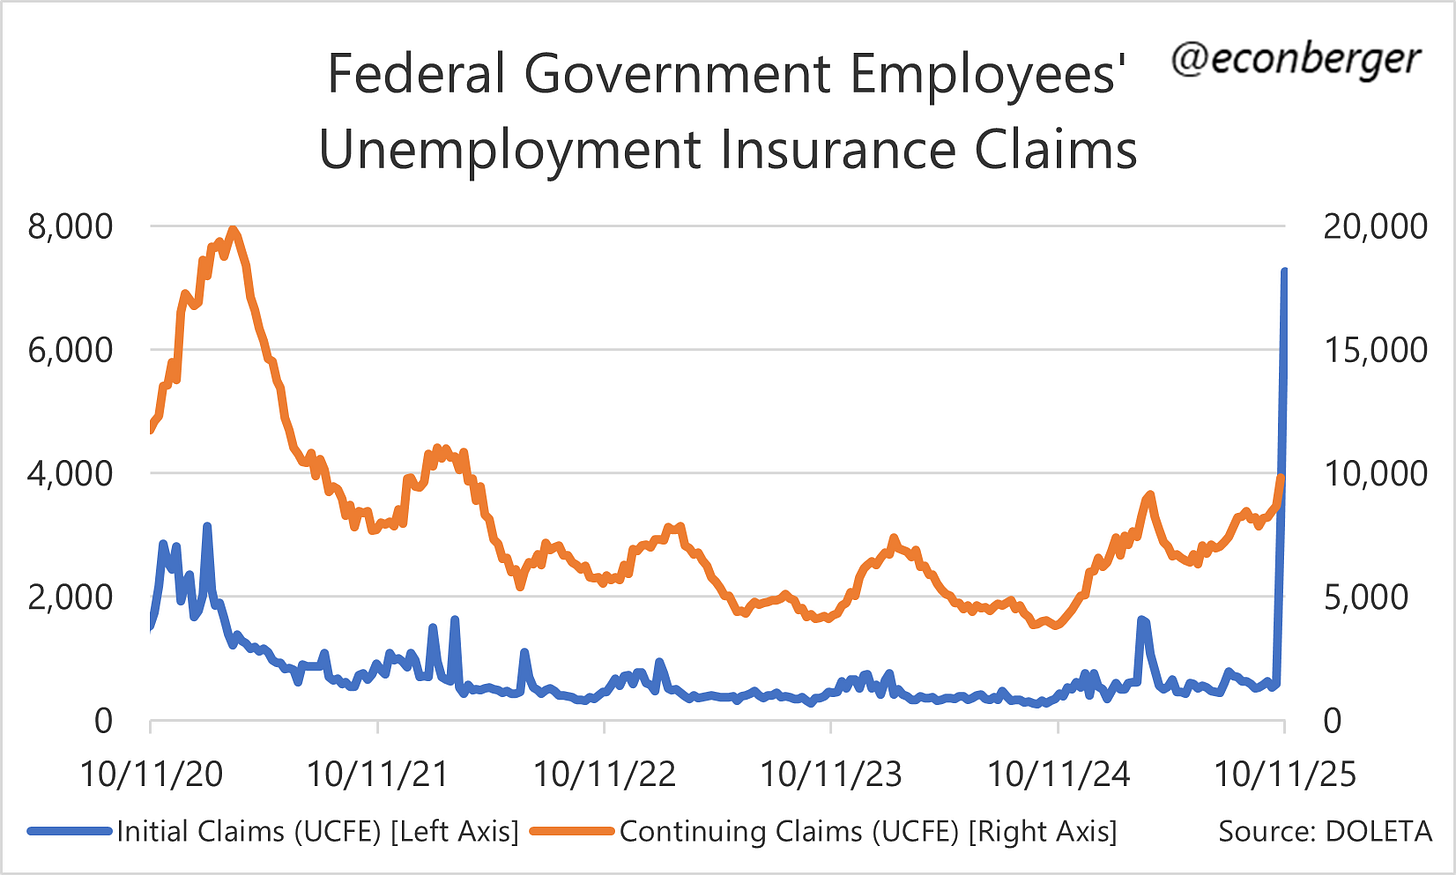
To reiterate, the series above are for non-federal-employee initial claims (i.e. state & local government and private sector). The federal employees are a separate line item which is currently spiking. 8K is pretty small - about 3.5% to 4% of regular initial claims. Still, the charts above would look a little worse if you incorporated this data into them.
I’d observe that so far continuing claims for federal workers have increased only a tiny bit (they’re just shy of 10K), but this data lags IC by a week. During the 2013 shutdown these rose as high as 77K. If that materializes, it would be equivalent to about 4% of regular continuing claims.
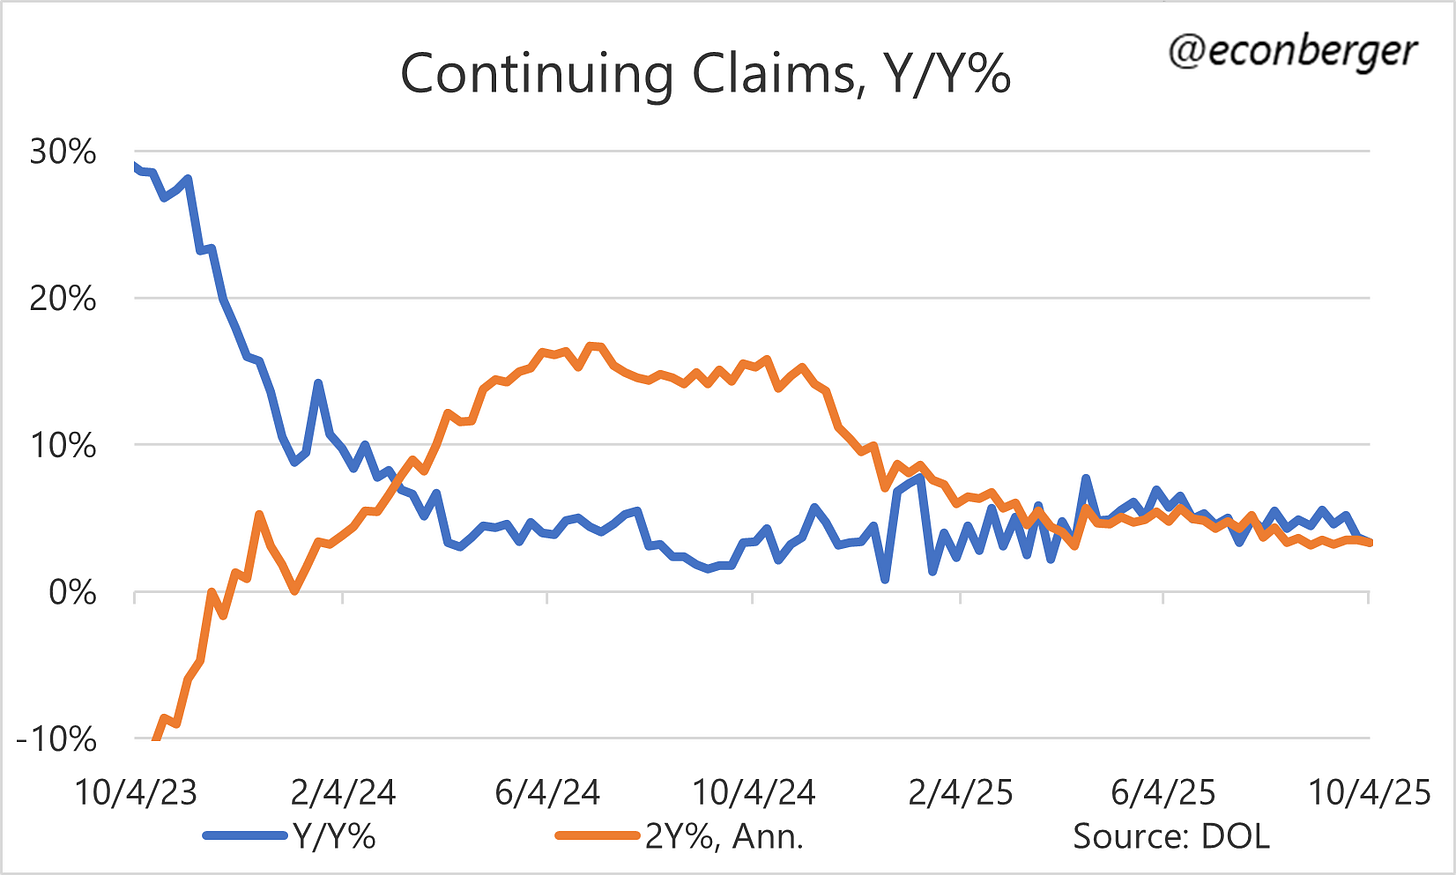
I haven’t talked about continuing claims yet, because so far there isn’t much to say. Unlike initial claims, we have just one shutdown data point. Trends relative to 2024 look a tiny bit better than they did before the shutdown began, though this is probably spurious: a very modest Helene base effect. On a 2Y basis nothing has changed.
As always, I prefer continuing claims to initial claims (for both federal and non-federal UI), so I expect these charts to gradually migrate upward in future editions of this writeup. But this week is too soon.
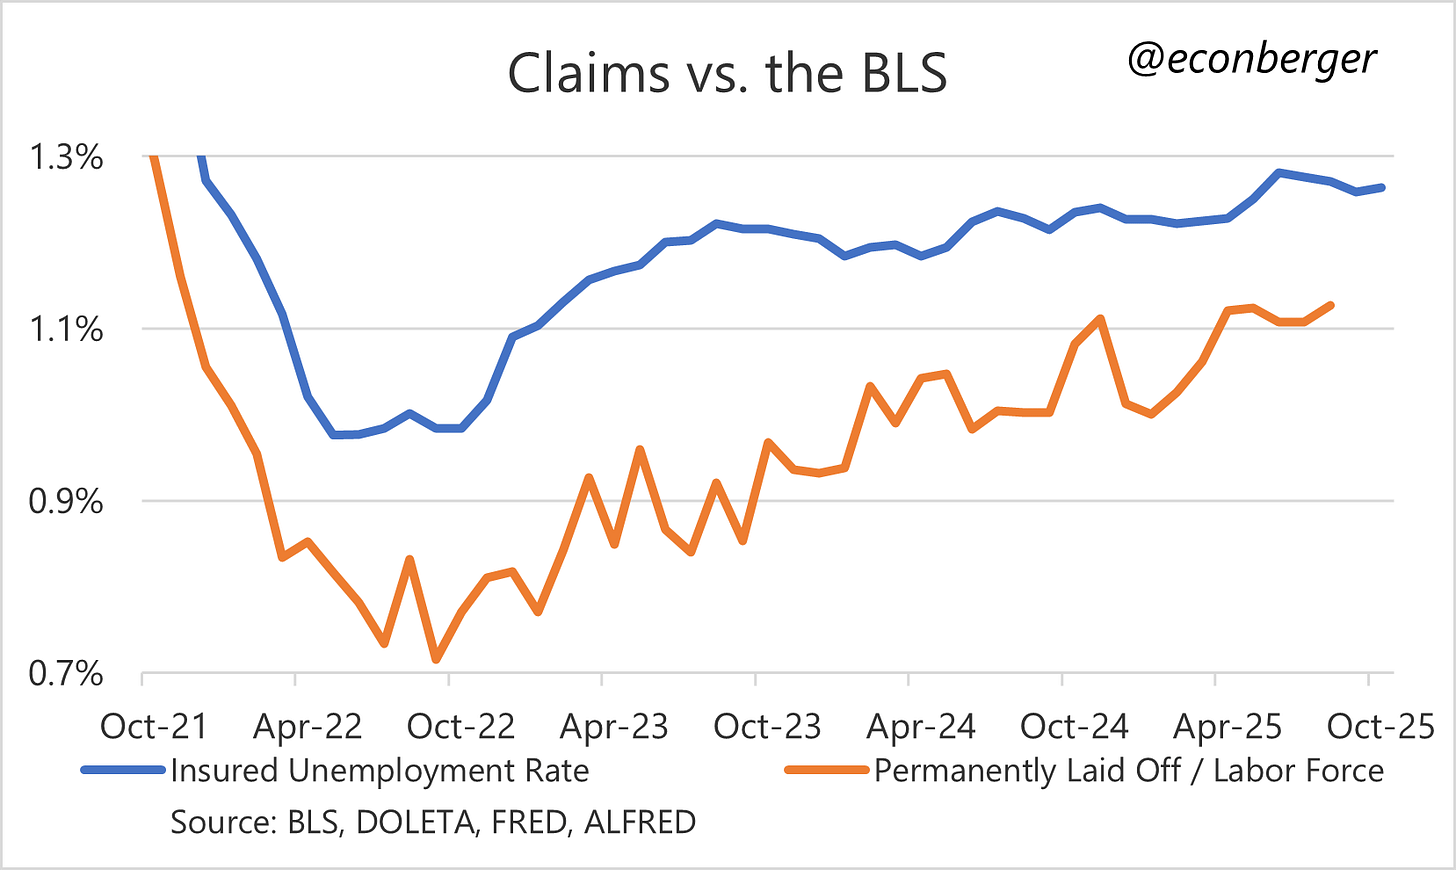
Finally, here are two of my regular charts. We have our first data point for the “unemployment due to permanent layoffs” nowcast. I haven’t added the federal continuing claims; at current levels, they would add about 0.005 percentage points to the insured unemployment rate.
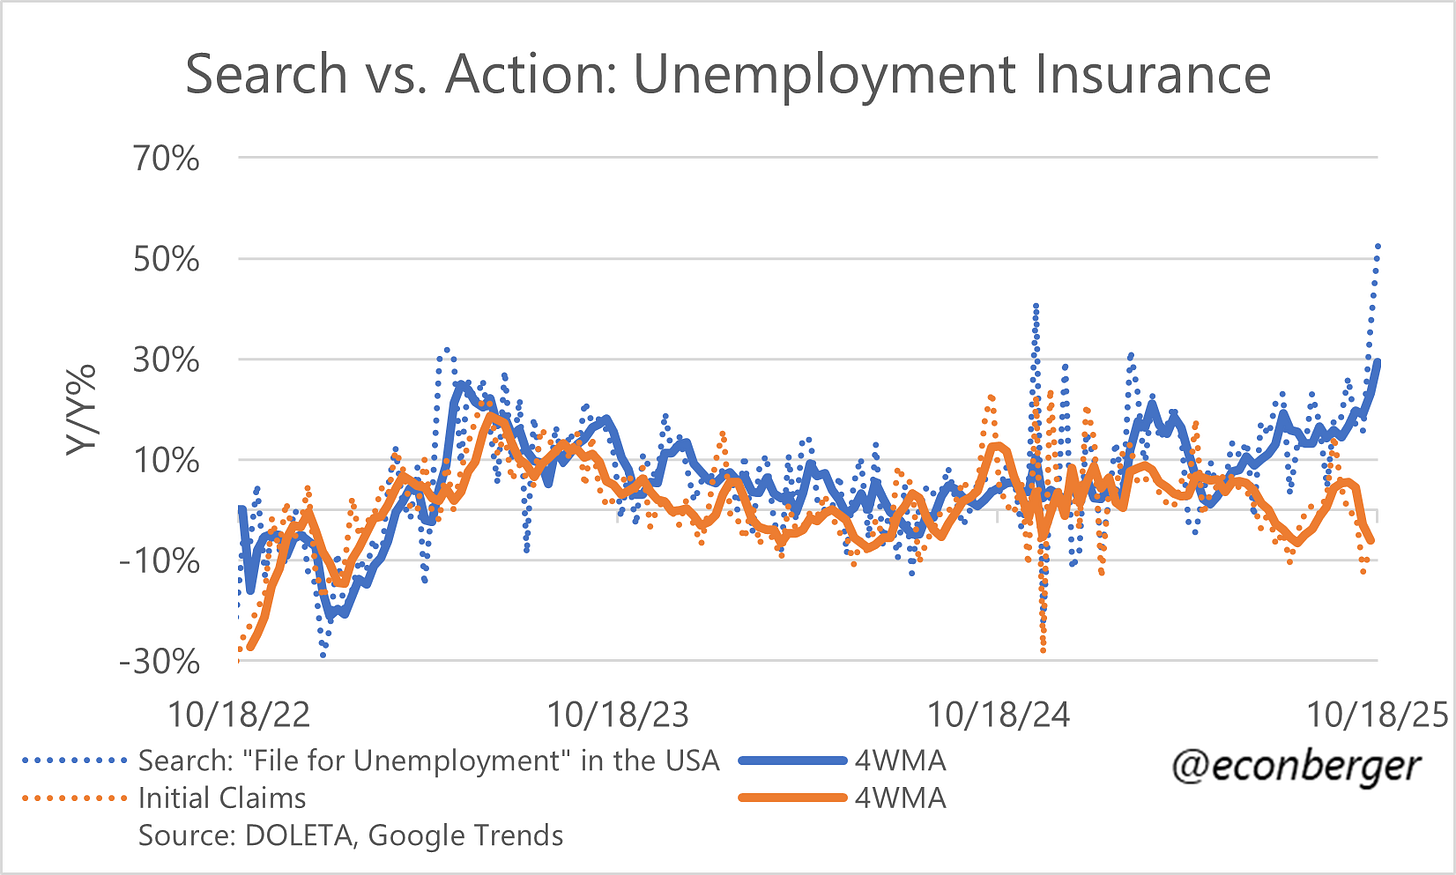
The other is google searches. The initial claims series in this chart excludes federal worker initial claims and has that weird Helene base effect (it would be modestly positive otherwise). But the gap between searches and reality is way too big to be entirely explained by those quirks:
4. Morning Consult Unemployment Rate
The wonderful people at Morning Consult have made the labor market data from their surveys. This and the Conference Board’s labor market differential are among my favorite private sector labor market sources because they try to measure slack rather than employment growth.
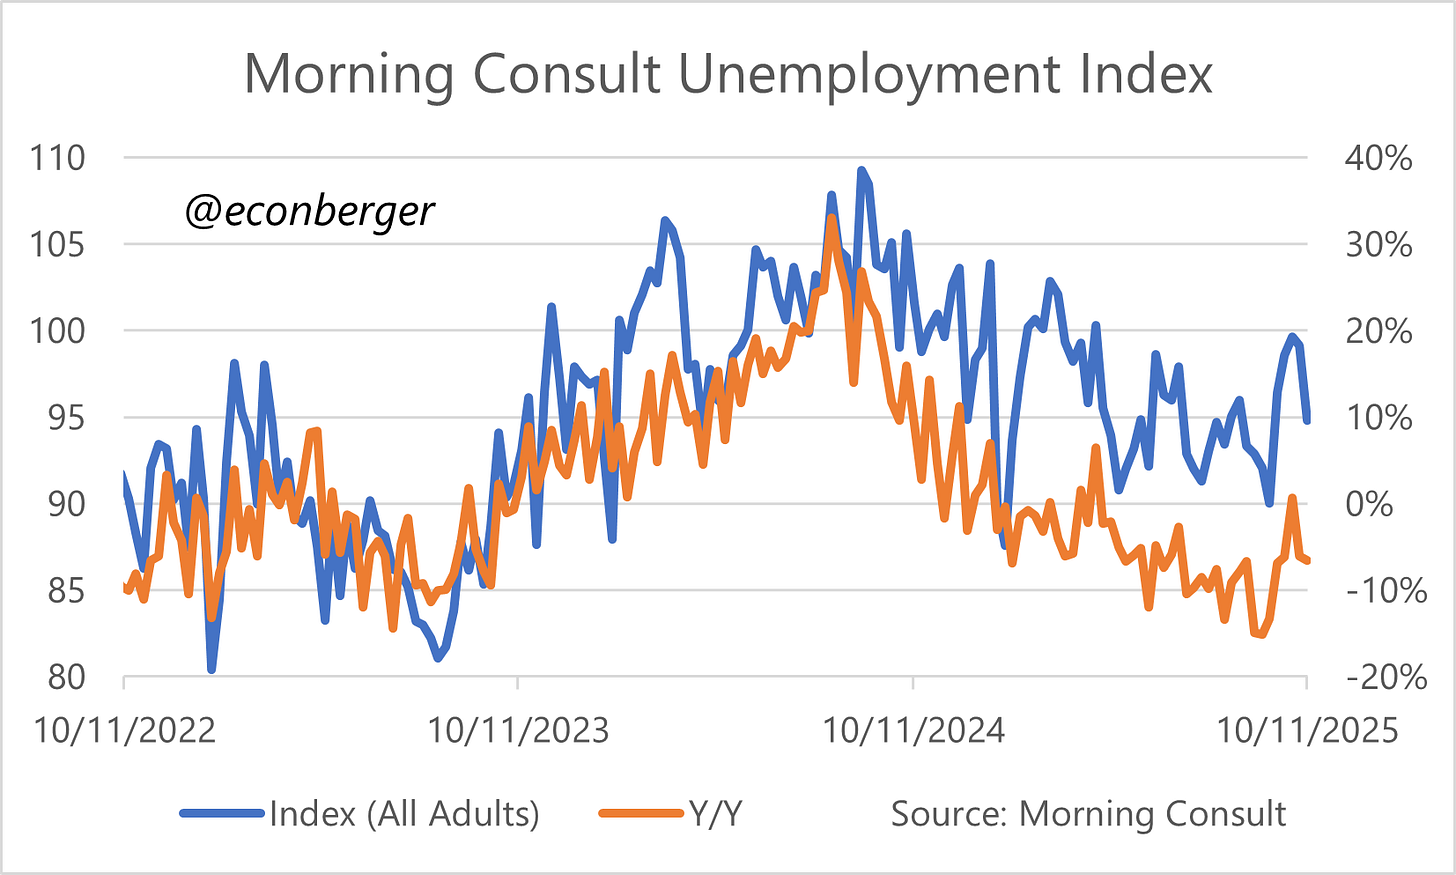
A few weeks ago it looked like the shutdown was heralding an increase in this measure, but the late September spike has faded. The most pessimistic interpretation is that the shutdown (and federal government workforce reductions) have caused a moderation in the index’s rate of decline. It’s a pretty stark contrast to what happened in 2023 and early 2024, when both BLS and Morning Consult measures showed a clear increase.
5. Reading List
At this point my reading list (unchanged for a long time) is a recurring punchline, but:
“Seeing economic data through the fog of immigration estimates” by Jed Kolko (Link)
“Generative AI as Seniority-Biased Technological Change: Evidence from U.S. Résumé and Job Posting Data” by Lichtinger & Massoum (Link)
“How Retrainable are AI-Exposed Workers?” by Hyman, Lahey, Ni & Pilossoph (Link)
“Evaluating the Impact of AI on the Labor Market: Current State of Affairs” by Gimbel, Kinder, Kendall and Lee (Link)


