


High Frequency Labor Market Indicators (3/27)
Business Headcount Plans, Claims, CPS Quasi-JOLTS, Conference Board

TL;DR: Lots to write about this week, but I think the ongoing deterioration in business employment sentiment and the relatively modest increase in claims are most significant.
More below chart.

1. Business Headcount Plans
Every two weeks the Census Bureau surveys a bunch of US firms about a variety of things, including their recent actions and future plans on headcount. After the election, we saw a marked improvement in future plans (though not recent actions), which was a big factor in my so-far-erroneous optimism about the 2025 labor market.
However, in the past 6-8 weeks that optimism has totally vanished; indeed, using a year-over-year comparison, the diffusion index of future headcount plans is now worse than it was immediately prior to the election. Additionally, and concerningly, that pessimism about the future is also affecting the present: the diffusion index of recent employment actions is trailing a year earlier by more than pre-election.
The improvement we saw in future headcount plans was driven primarily driven by a reduction in the share of firms planning to shrink employment. That improvement has totally reversed; for the first time since at least September 2024, more firms expect to cut employment over the next 6 months than a year earlier. We’ve also seen a steep deterioration in the share of firms who want to increase their headcount in the next 6 months, bringing it back to where we were 6 months ago.

The deterioration in recent (last 2 weeks) headcount actions has come from both sides of the ledger. Slightly fewer firms plan to increase headcount; slightly more firms plan to slash it.

The deterioration in future hiring plans is happening across all firm sizes. Small firms, medium ones, big ones - they were all more optimistic a few months ago than they were now.

Last but not least, a big policy goal right now is boosting employment in the manufacturing sector. Firms in this sector were indeed quite upbeat about employment after the election - more than elsewhere in the economy. But the reversal in their sentiment about future hiring plans over the past 8 weeks has been, if anything, more extreme than their non-manufacturing peers.

We don’t, yet, see this in the hard data (see next section). I wonder if we’ll see stabilization soon at these lower levels, since the stock market has also leveled out. But if so, that would still be a pretty glum outcome for those of us hoping for a stronger labor market in 2025.
2. Claims for Unemployment Insurance
Initial claims continue to run slightly above year-ago levels, a pattern that began late last year. This pattern of rising layoffs is occurring across multiple data sources (not just unemployment insurance claims), and so far I’d classify it as “worth keeping an eye on” rather than “seriously concerning”.
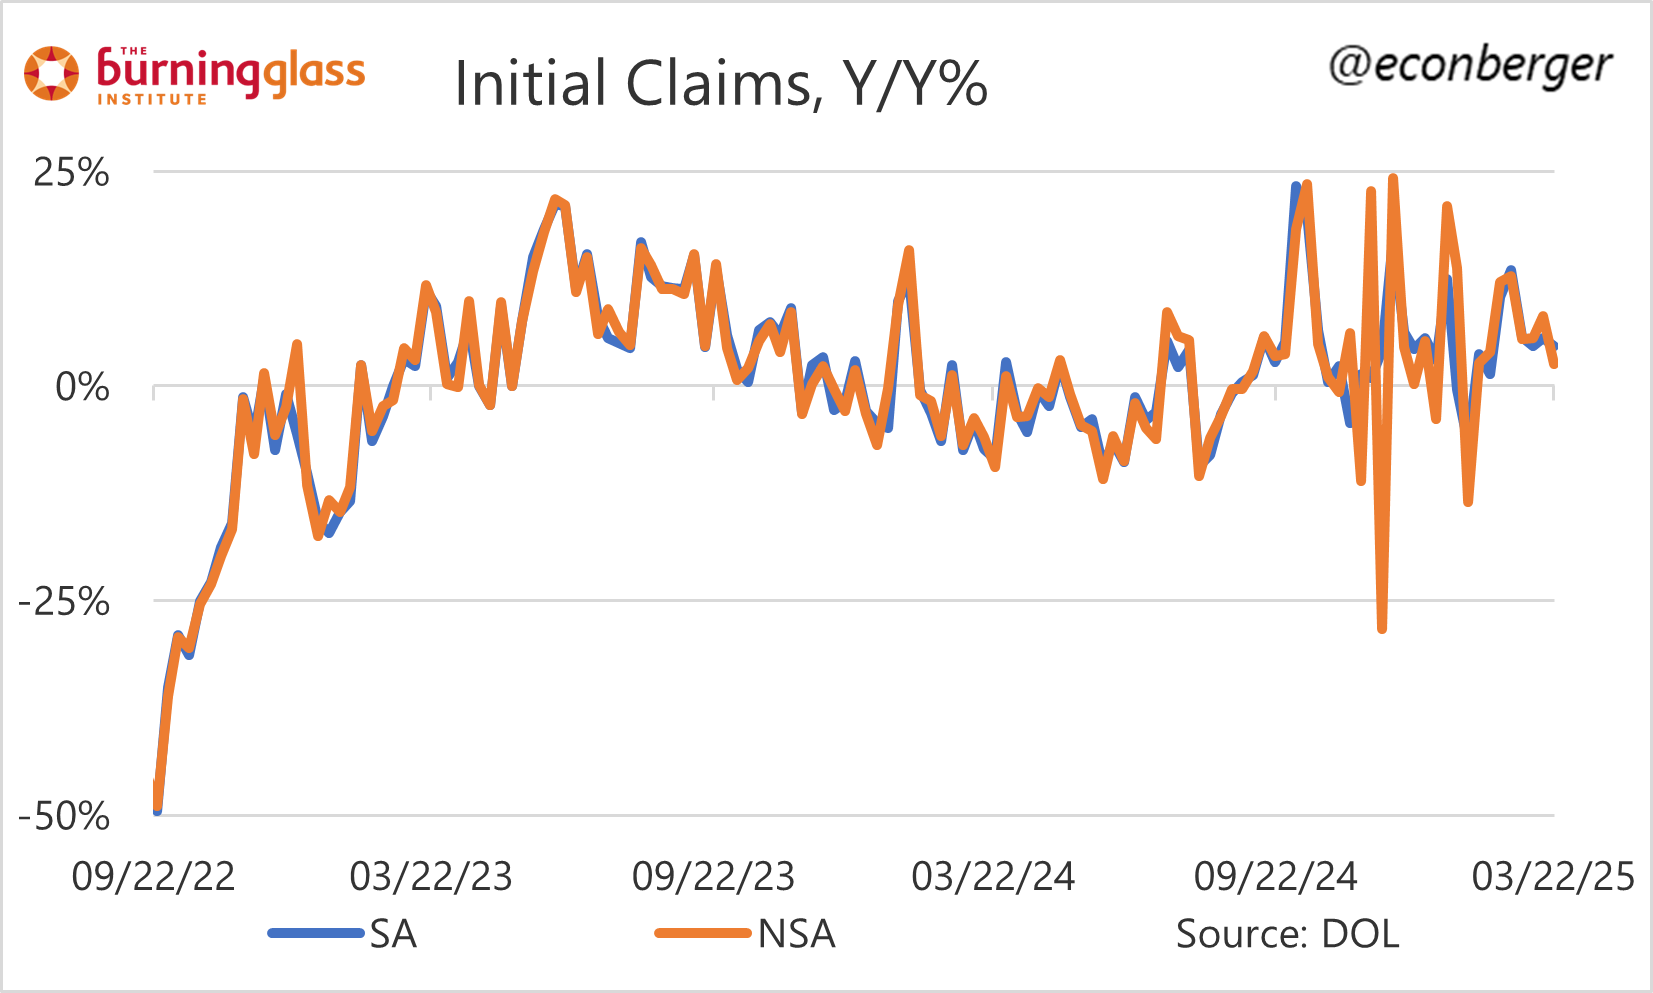
What’s interesting is that the ongoing, modest increase in continuing claims has not really changed much - i.e. layoffs have gone up a little after a period of going down a little, but the total claimant count has just grown steadily.
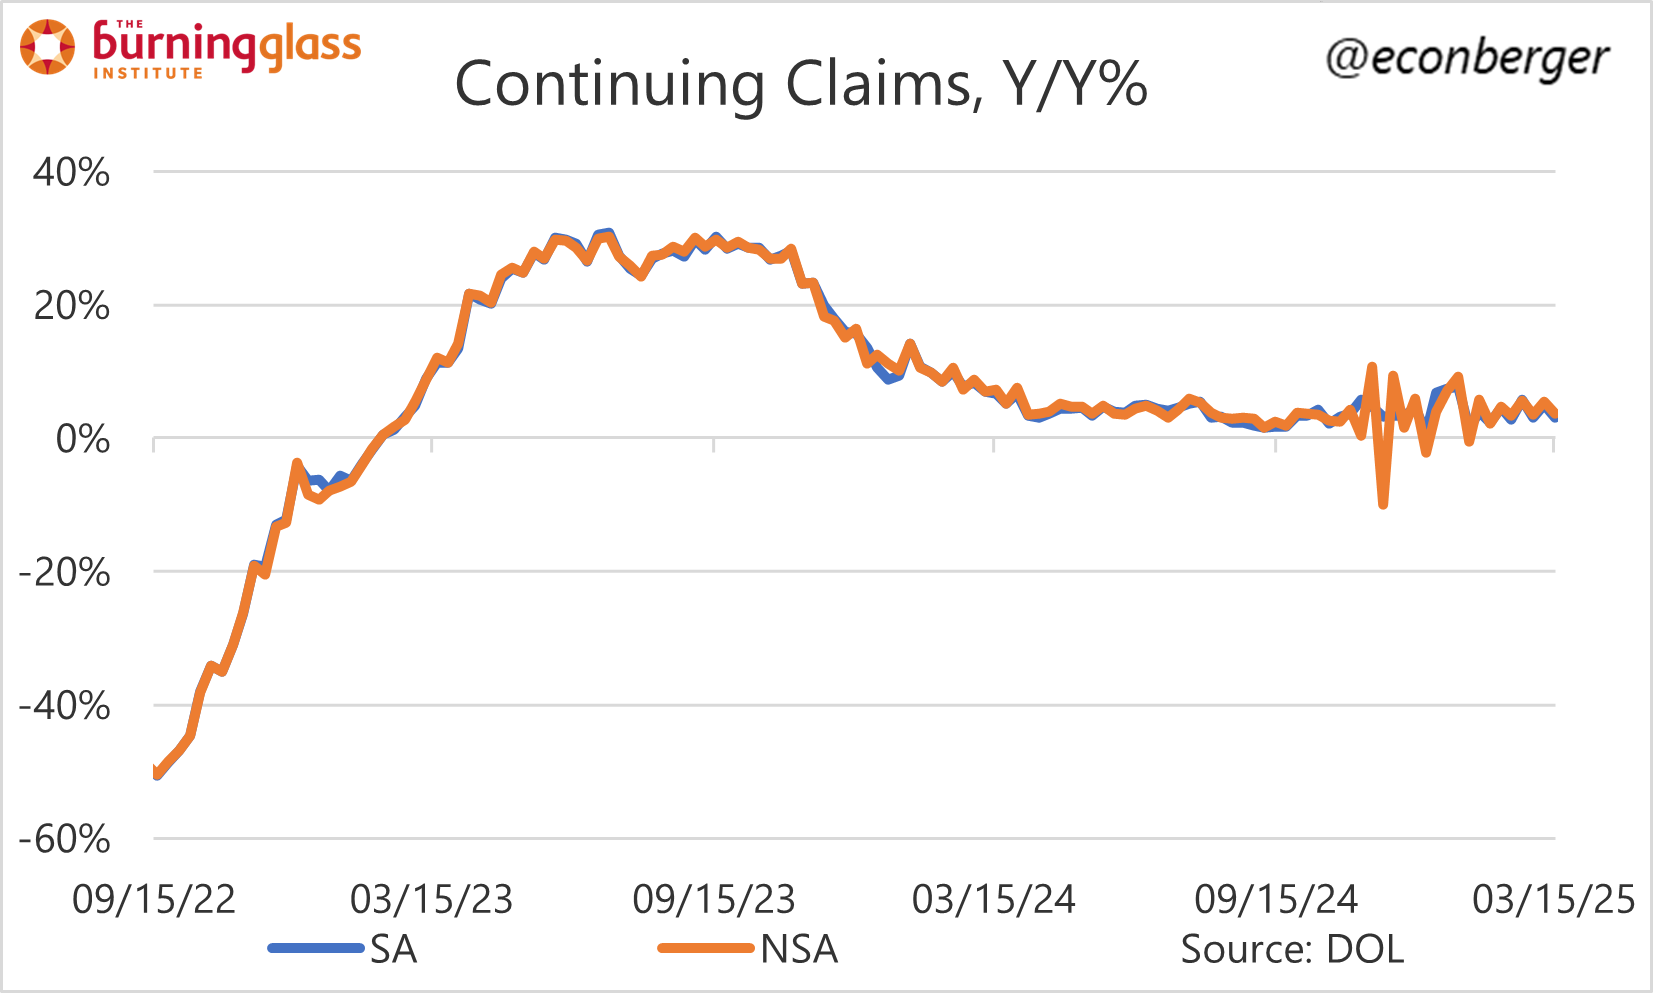
Maybe the numbers are too small to matter. Maybe it’s that employers changed their turnover mix a tiny bit late last year, with hiring stabilizing and layoffs picking up a little.

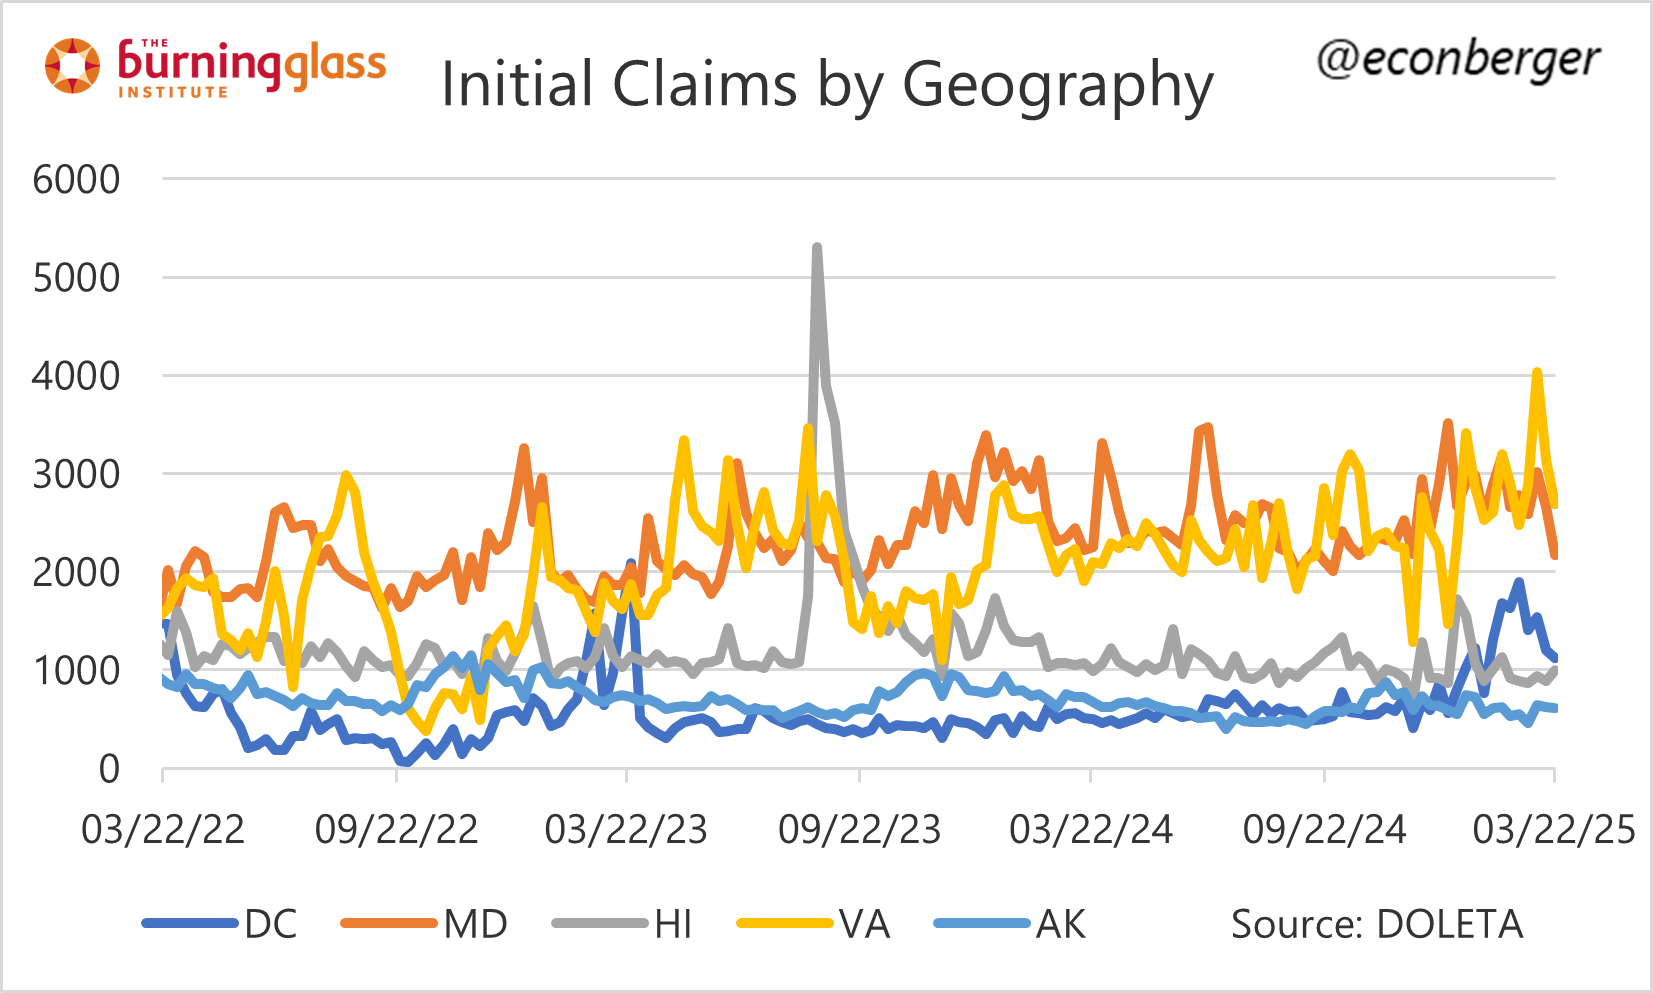
In any event, besides the overall layoff and unemployment picture, we’re also interested in whether the government austerity drive is having an impact. The answer is, yes, a small impact. In the regular claims data (excluding federal workers), we saw a spike in layoffs in DC, Virginia and (maybe) Maryland that shows signs of abating.
Initial claims by laid off federal workers are also showing some signs of normalization, though the total number of claimants is still rising.

I’ve seen a variety of alternate explanations for why the UCFE numbers have not been bigger. Some folks argue that the layoffs are larger but a lot of workers are not eligible (in which case we’ll see a bigger than expected jump in BLS-measured unemployment); others note that many of the laid off workers are still on administrative leave and thus “employed” for a little while longer. In any event, I’ll be tracking this data regularly.
3. CPS-Based Measures of Turnover
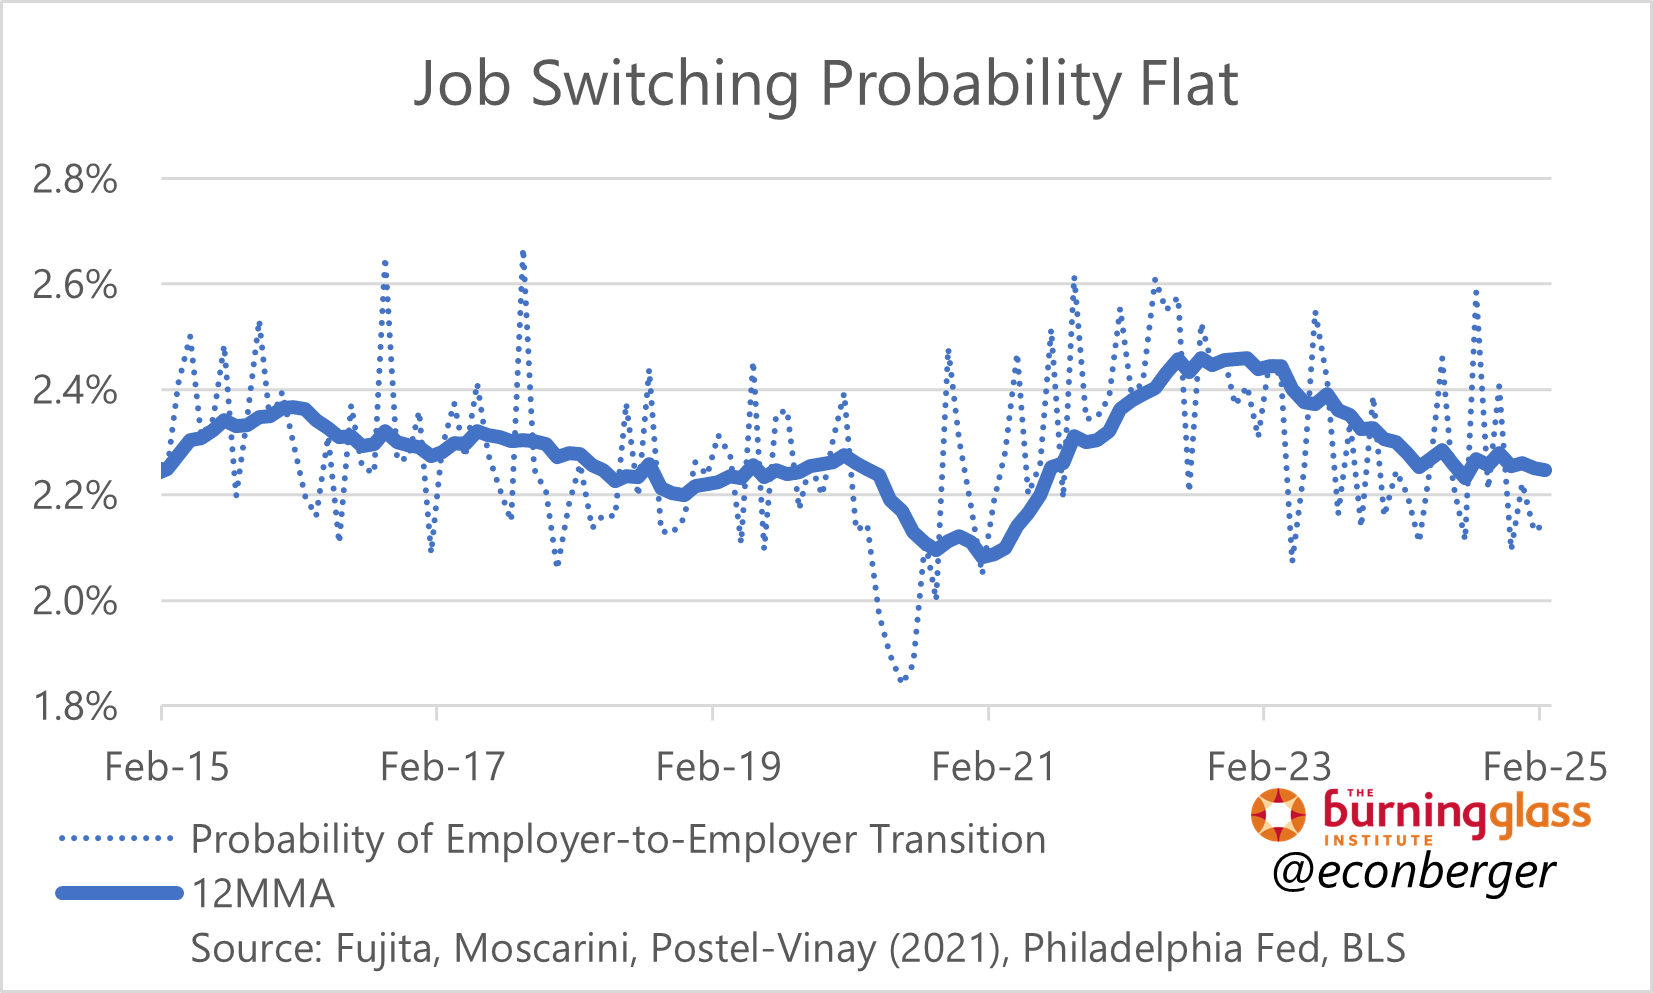
I’m a Current Population Survey superfan, and some of my favorite indicators try to use CPS data to replicate another favorite survey (JOLTS).
Fujita, Moscarini, and Postel-Vinay have a measure that tracks a subset of quits, from one job to another. This has been flattish for the past year, though it’s possible we’re starting to see renewed deterioration.
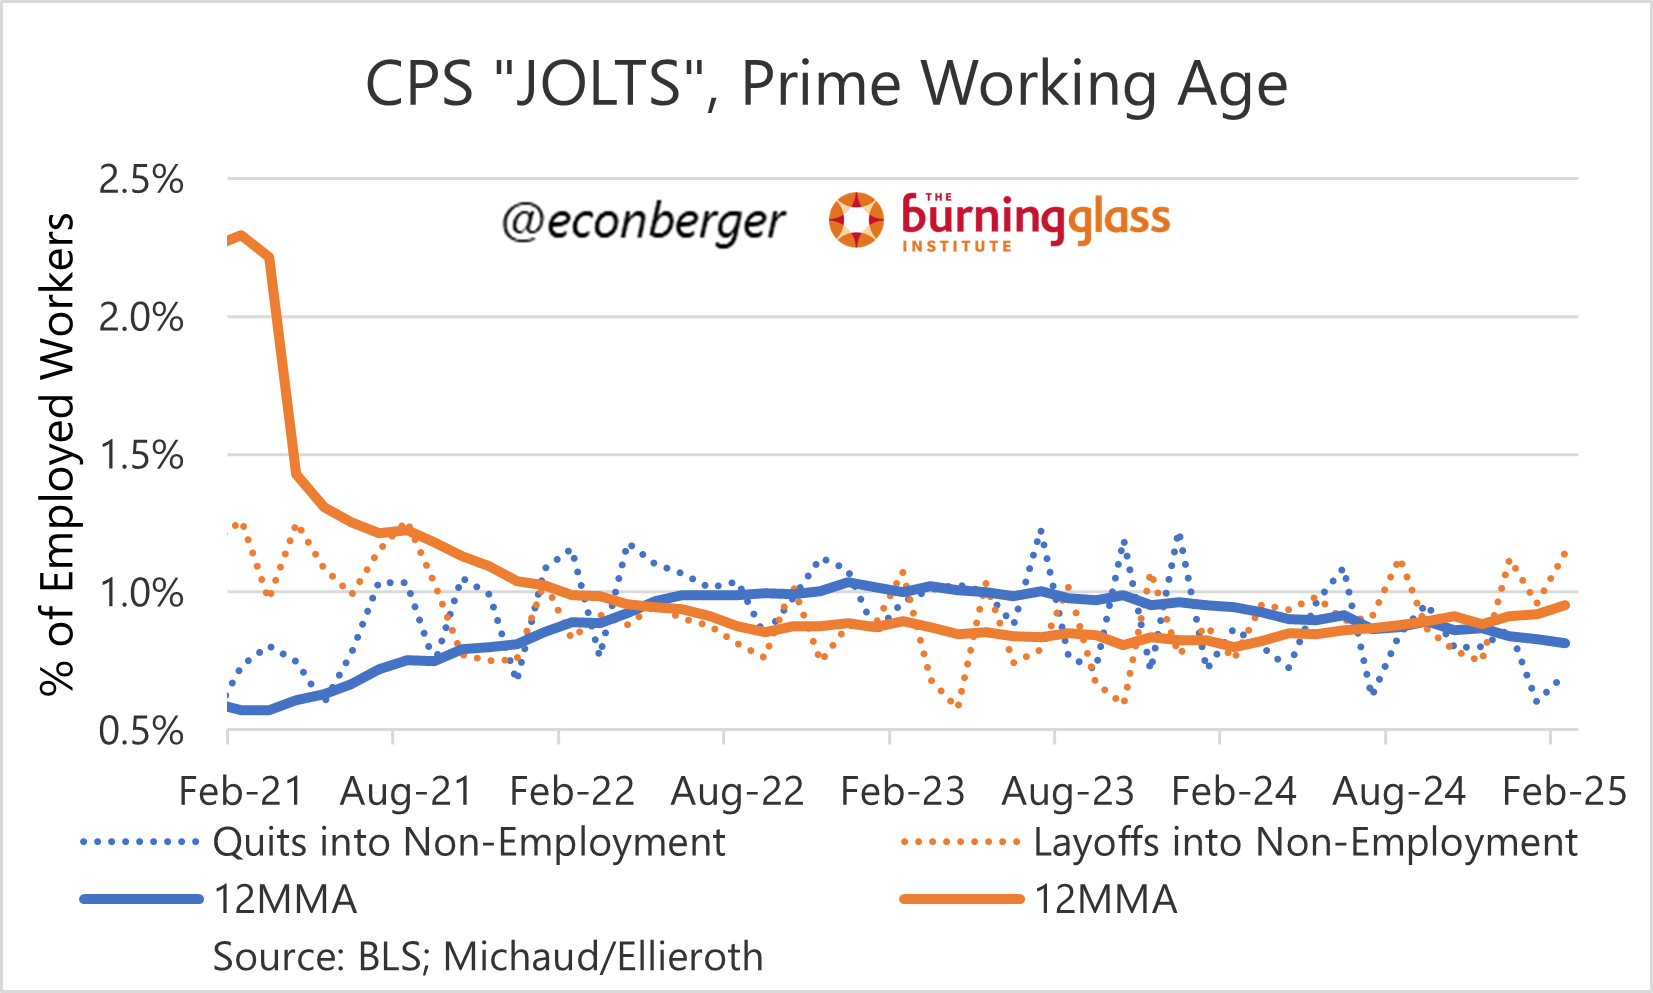
Of course, some quits are into non-employment, and on that front, Michaud and Ellieroth indicate a still-worsening picture. They also detect an ongoing increase in layoffs, corroborating the increase we see in JOLTS, initial claims and Challenger layoff announcements.
4. Labor Market Differential
I’m borrowing this chart from the WSJ’s Nick Timiraos. This indicator is one of the most useful labor market metrics to come from any consumer survey. It’s been holding up ok recently, though I do wonder whether there’s residual seasonality that’s about to hit us in the face over the next few months. We’ve seen some big springtime plunges in each of the past 3 years.
