TL;DR: Last month’s jobs report got serious dings from hurricanes and strikes, so a robust November rebound is in the cards. But the most important question we want clarity on: in which direction is the labor market trending?
The rest of this report is divided into:
The Big Picture
Hurricane/Strike Rebound
Future Benchmark Revisions
Other Key Data in the Report
Odds & Ends
More Below Chart
1. The Big Picture
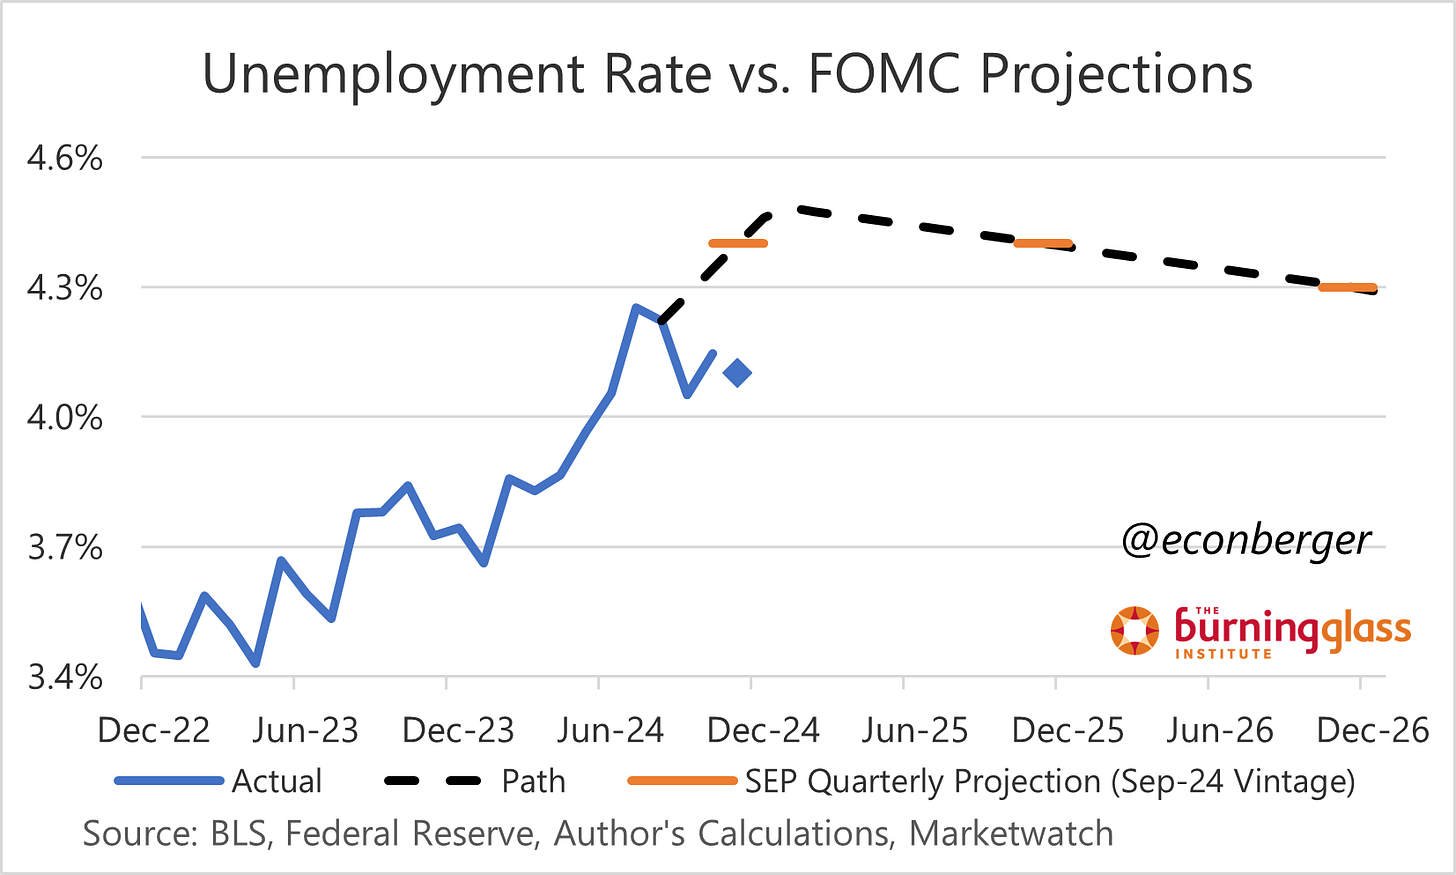
During the summer, there was a steady drumbeat of “labor market cooling” news, both from the monthly jobs report and from its JOLTS sibling. The unemployment rate lurched upward by 0.6 percentage points from January to July, gains in nonfarm payroll employment had slowed (and were likely overstated due to future revisions - more below), and hiring/quits rates were sliding.
The picture has turned more ambiguous since then. The unemployment rate has fallen a little; nonfarm payroll employment has been wracked by all sorts of special factors (strike; hurricanes); the JOLTS data has been confusing. It would be really useful to get a good read on where we are, and where we’re headed. That question is particularly relevant because there are several forces in motion that could lead the labor market pendulum to swing in the opposite direction.
The force that’s gotten the most attention is the Fed easing in response to labor market cooling. At some point, lower interest rates should (through a variety of channels) stabilize or even stimulate the labor market. We’re early in that process (and a recent firming of inflation data raises questions about how far/quickly it will go), but businesses are forward looking and it’s conceivable they’ll turn on the hiring taps soon.
Additionally, the immigration-driven labor supply expansion may be petering out. Whether via tighter enforcement or because fewer people are coming, there are fewer people crossing the southern border. The southern border is not the only channel through which people are coming in - there’s the northern border (presumably less porous?) and also more conventional visa-authorized work - but the supply-side loosening of the labor market will wind down soon. And that’s even before the next administration, which has aggressive deportation plans, takes office.
Finally, more on that new administration and their plans: it’s still not clear what will actually become policy. There’s a very narrow Congressional majority. Some stuff will probably get implemented via executive actions. But a large tax cut, deregulation of business, pressure on the Fed to conduct easier monetary policy, and of course lower labor supply growth are all actions that could lead to stronger hiring and less slack, at least in the short run.1 There’s also the harder-to-quantify possibility of “animal spirits” picking up.
I’ll wrap up this section with a prediction: if the labor market does reheat in 2025, it will show up through hires/quits and slack measures, with much less impact on net employment growth - the mirror image of early 2024, when we saw employment growth booming at the same time as unemployment rose and hires/quits fell.
2. Hurricane/Strike Rebound
October’s feeble job gain in nonfarm payroll employment (+12K) reflected two temporary factors - the Boeing and Textron machinist strikes (about 38K) workers as well as the aftermath of two southeastern hurricanes (Helene & Milton).
The impact of returning strikers is easy to estimate (though some 2nd order effects from workers in the supply chain who were furloughed could make it larger).
The hurricane impact is messier to assess. It’s normal for there to be fairly large post-hurricane rebound effects in nonfarm payroll employment, sometimes a month later and sometimes two months later - over the past 2 decades, the typical “extra” gain over the following 2 months is about 150K.
But just like October’s data was exaggerated downward, we’ll probably get ephemeral extra strength from the rebound effects. Averaging September/October/November or October/November/December will be a good idea. The resulting average will probably be fairly ho-hum, between 100K and 150K per month.
What about other parts of the report? well, I don’t expect much of an October-November shift in the household survey metrics - people who have a job but are absent from it due to weather count as “employed”.
3. Future Benchmark Revisions
The preliminary benchmark estimate of -818K to March 2024 nonfarm payroll employment generated a lot of hubbub. Subsequently, I started sharing my nonfarm payroll employment charts with a proposed adjustment for future benchmark revisions - with a speculative assumption being that the overestimate of employment gains in the year to March 2024 was possibly continuing past that date.
We got a little bit of evidence in support of this assumption with Q2 2024 data from the Quarterly Census of Employment and Wages (QCEW). The QCEW is the fundamental source for annual revisions to the Current Employment Statistics (CES) or “establishment survey” that provides us with nonfarm payroll employment estimates, so weakness in the former can imply future revisions to the latter. However, it is also true that the QCEW is much noisier than the CES on a high frequency basis; there’s a reason why the CES is benchmarked to it on an annual basis rather than a quarterly or monthly one.
The underperformance of the CES relative to the QCEW worsened in Q2 relative to Q1. Again, taking the benchmark process into account, this is just 1 quarter of new-but-noisy data that could easily be negated by the next 3 quarters. But on balance this should make us a little more worried that current monthly job gains are overestimates.
As always, a reminder - many statistics in the jobs report, including the unemployment rate, labor force participation and the employment population ratio come from a totally different survey (the Current Population Survey, or “household survey”). These are completely unaffected by the QCEW and benchmark process.
4. Other Key Data in the Report
I haven’t spoken much about the household survey data, so here are a few thoughts.
First, I came out of the October jobs report thinking we would see a slight downtick in the unemployment rate during November. The reason? The increase was driven by one segment, “unemployment due to permanent layoff”, that tends to be closely associated with continuing claims for unemployment insurance. My assumption was that the October increase in continuing claims was hurricane and strike driven, and would reverse as those ended.
However, we haven’t seen those increases unwind. The insured unemployment rate (continuing claims as a share of “covered employment”) has remained slightly elevated in November relative to the summer. So it may be that the increase in unemployment due to permanent layoffs we saw in October, and therefore the increase in overall unemployment, “sticks” in November.
The other thing that struck me about the October household survey data was the decline in prime-working age employment. Even as other data softened earlier this year, the share of prime-working age Americans with a job held at a cyclical high of 80.9%; it was a lonely consistently-reassuring island in a sea of mildly bad news. I’m really curious what November brings on this front.
5. Odds and Ends
I’m always interested in new labor market signal, so here are a few things I’ve been mulling over. I may write more about them in the next few months but here are snippets of ideas rolling around in my head, for better or worse.
a. Census Bureau Trends and Outlook Survey
This is a very cool biweekly survey with 14 months of history that asks US firms about a range of their activities. There are useful cuts by location, industry and firm size. Up until recently I was mostly utilizing it to track AI adoption, but there are also questions about employment! And one glimmer of good news is that US firms’ headcount plans are more positive (on a diffusion basis) than they were a year ago.
We don’t have enough history to be sure whether this is a reliable indicator. But I plan to follow it closely since it is forward looking.
b. CPS-Based Measures of Quits and Separations
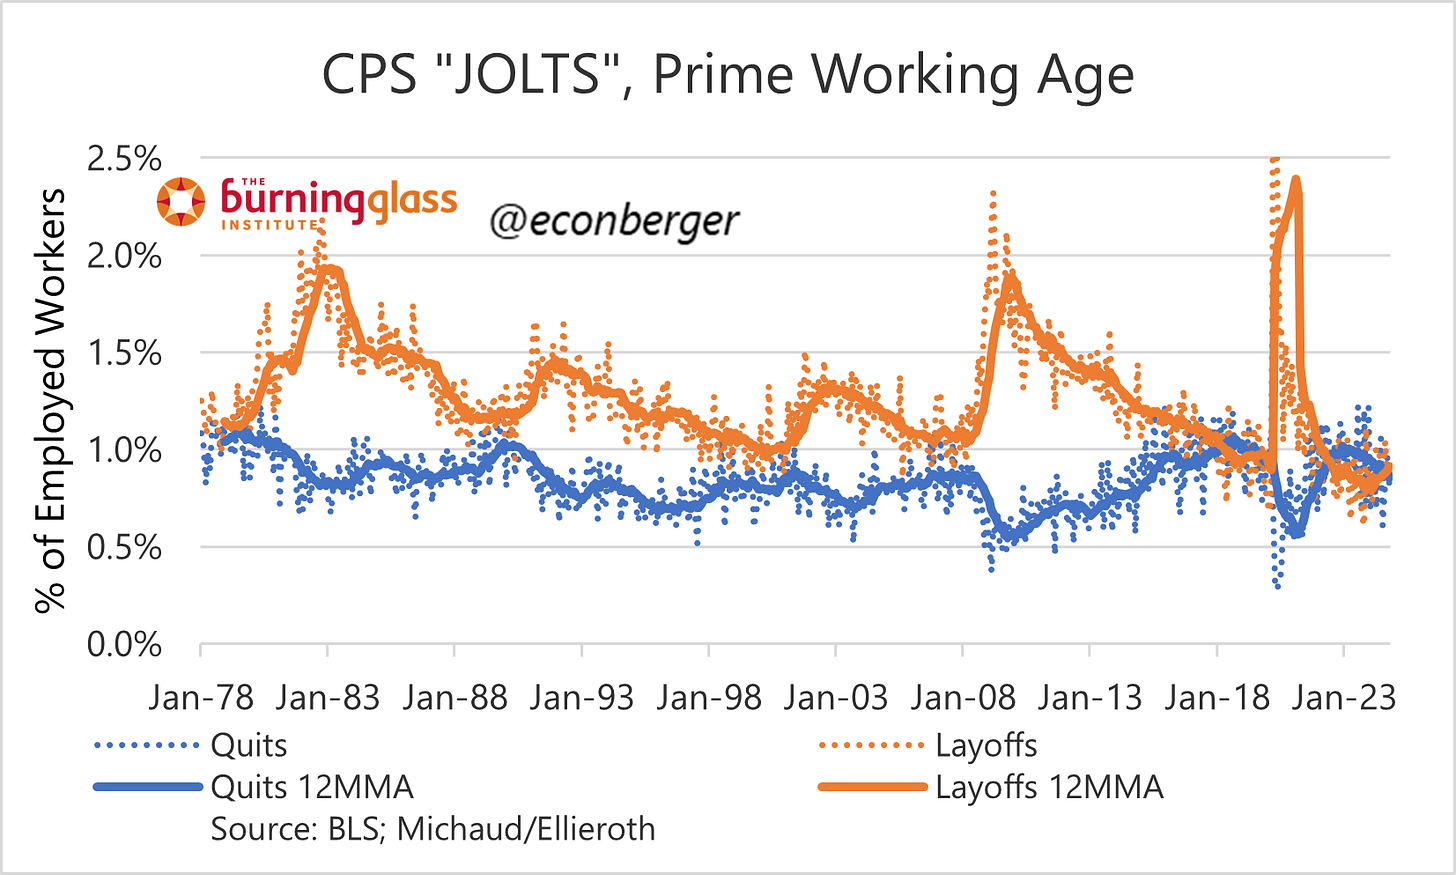
Amanda Michaud (Minneapolis Fed) and Kathrin Ellieroth (Colby College) have constructed measures of quits and layoffs based on the Current Population Survey that parallel the ones in JOLTS (which is an establishment survey related to the CES).
I’m still not sure how useful this data will be on a high-frequency basis since CPS data is noisy. (At the very least, it will be a useful supplement to the revisions-suspectible JOLTS.) But one very interesting angle Amanda and Kathrin provide is how shifting demographics are impacting turnover. If you look at their CPS-based measures of quits and layoffs over the past 46 years, there’s a secular downtrend through at least 2008. That secular downtrend is gone, especially for quits, once you limit consideration to prime-working-age adults. I wonder if some of the cross-cyclical drift in the JOLTS data is suffering from this same issue.
c. CPS-Based Measure of Job-to-Job Transitions
Another CPS-based JOLTS-like measure is the Fujita, Moscarina, Postel-Vinay job-to-job transitions metric. This includes only a subset of what we think about as quits, since many people quit their jobs to jobless status (Michaud and Ellieroth look at voluntary job-to-no-job transitions, but not job-to-job transitions). These job-to-job transitions stopped falling since the spring. I don’t have a strong opinion on this rebound, but if we see a rebound in Michaud/Ellieroth, that will be noteworthyl
On the flipside, a lot of these forces might also be inflationary. That means higher interest rates as long as the Fed manages to resist political pressure.


